Showing Posts From
Audience retention
 CreatorPlaybook Team
- 03 Nov, 2026
How to Read Your YouTube Retention Graph: Dips, Spikes and What to Fix First
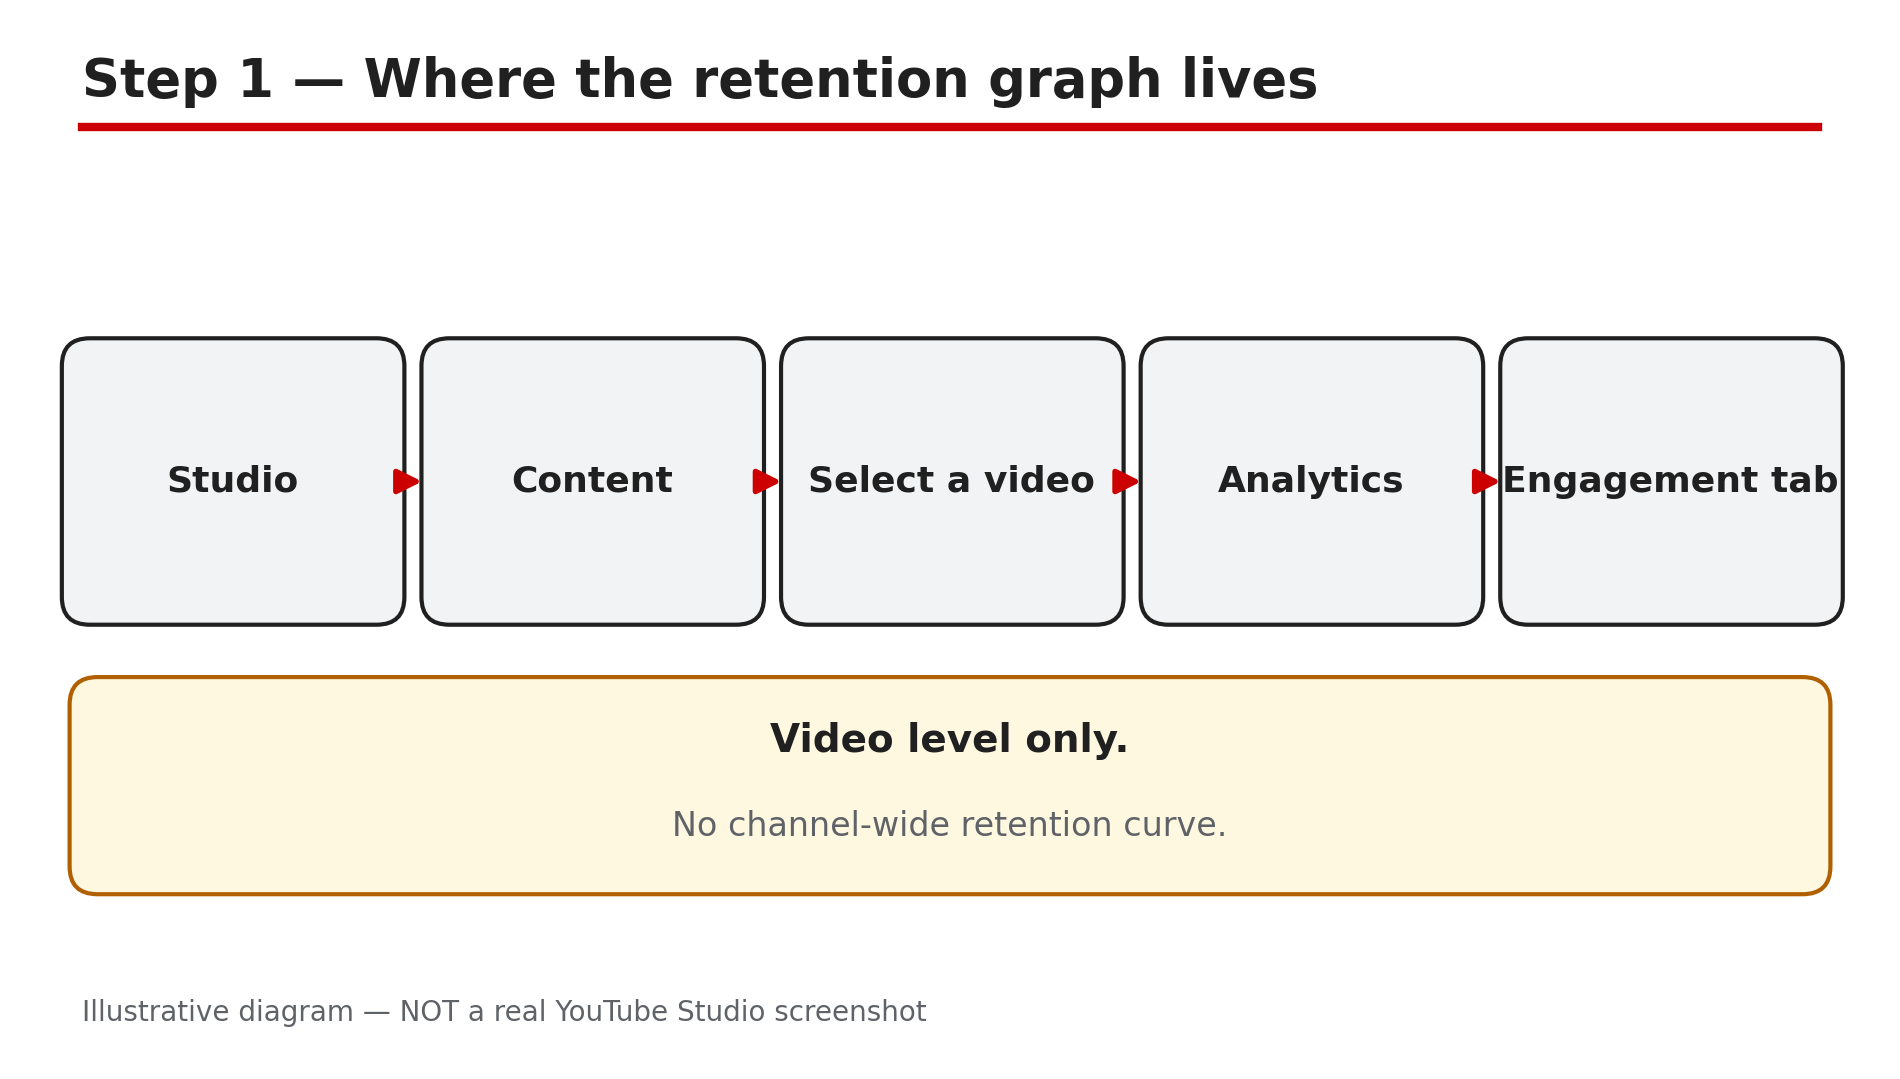
A thumbnail can lie. A title can over-promise. But the retention graph cannot lie: it shows, second by second, where real viewers decided your video was not worth more of their time. Every creator has stared at that falling line and wondered what to do about it — and most of them fix the wrong part. The graph is not one number. YouTube's Analytics labels four kinds of moments on it — Intro, Top moments, Spikes and Dips — and each one points at a different fix. A steep cliff in the first 30 seconds is a hook problem. A dip halfway through is a slow section to cut. This guide shows you where to find the graph, how to read each shape, and the order to fix things in. What You Will LearnWhere the retention graph lives in YouTube Studio The four key moments YouTube labels, and what each one means The four shapes that show up most, and the fix for each How to compare a video against your own typical retention Why there is no official retention target to chase The one mistake that makes a good graph look badStep 1 — Open the graph for one video, and wait for the data What to do: Open the retention report for a single video, and only trust it once the data has had time to process. How: In YouTube Studio, go to Content, select a video, then Analytics, then the Engagement tab. The audience retention report sits there. YouTube's Help page says the report explains how well different moments of your video held viewers' attention — but the data typically takes 1–2 days to process, and it is only available at the video level, not for the whole channel. Key moments are only labelled when YouTube detects them, and only on videos at least 60 seconds long with at least 100 views. Example: A creator checks a video two hours after publishing, sees a flat line at 20%, and panics. Two days later the same video shows a normal curve. Common mistake: Judging a video on day one. Wait at least two days for the data.Illustrative diagram of where to find the audience retention graph in YouTube Studio. Step 2 — Learn the four labels YouTube puts on the graph What to do: Learn the four official terms before you interpret anything, because each one means something specific. How: YouTube's Help page names four types of moments. Intro tells you what percentage of your audience still watched after the first 30 seconds — your hook's report card. Top moments are moments where almost no one dropped off. Spikes are moments that were rewatched or shared — but YouTube also warns that a spike can mean your content was not clear and the audience had to rewatch a section. Dips highlight moments that were skipped or where viewers stopped watching. YouTube also draws a grey band: your typical retention, from your last 10 videos of similar length. Example: A creator's graph shows an Intro of 62%, a Top moment at the worked example, a Spike at the price reveal, and a Dip at the sponsor read. Four labels, four different jobs — and only one is a problem. Common mistake: Treating every dip as a disaster and every spike as a triumph. A spike can be confusion.Illustrative diagram of the four key moments YouTube labels on the retention graph. Step 3 — Read the shape of the line, not just the number What to do: Match the shape of your curve to one of four patterns, and let the pattern choose the fix. How: The most common patterns are four. A steep early cliff in the first 30 seconds means the opening did not confirm what the title and thumbnail promised — fix the hook. A mid-video dip at one timestamp means a specific slow section — watch the 15 seconds before the drop, because the cause is usually just ahead of it, then cut or tighten that section. A gentle steady decline is normal: audiences shrink over the length of a video, and a slow slope is not a fault. A flat line means viewers are watching that section start to finish — that is the goal, not a problem. Example: A 10-minute video falls from 100% to 55% in the first 30 seconds, then declines gently to 40% by the end. The problem is entirely in the first 30 seconds. Common mistake: Re-editing the whole video when the graph shows one dip. Fix the first big drop first.Illustrative diagram of the four retention curve shapes and the fix for each. Step 4 — Compare against your own typical retention, not a benchmark table What to do: Judge each video against your own last 10 uploads of similar length, and ignore any table that claims YouTube has a target number. How: YouTube publishes no universal retention target. Its Help page says only that you can use typical retention to compare your 10 latest videos of similar length — and its Content tab tips add that videos with 50% or more of the audience still watching after the 30-second mark can be found in the "above typical intros" list. Third-party benchmark tables — the kind that say 30% is poor and 60% is excellent — are not YouTube's numbers. A 2025 study of 10,000+ videos reported average retention near 23.7% — a reported study figure, not a target. Example: A gaming channel's typical retention is 35% at the end of a 12-minute video. A new video ends at 42% — above its own grey band, a clear improvement. Common mistake: Chasing a magic number like "70% intro retention" that YouTube has never published.Illustrative diagram of comparing a video against its own typical retention. Step 5 — Split the graph by audience before you change anything What to do: Use the segments report to find out who is leaving, because the fix depends on which viewers drop off. How: YouTube's Help page says the audience retention segments report lets you compare new viewers against returning viewers, and subscribers against non-subscribers. If subscribers stay and new viewers leave early, your intro is speaking to insiders — it assumes knowledge a first-time viewer does not have. If returning viewers leave and new viewers stay, the video may be repeating something your regulars already know. Example: A channel's tutorial shows a dip at 2:00 for new viewers only — the section assumes the viewer knows the tool's menu layout. The creator adds a five-second orientation, and the dip disappears. Common mistake: Rewriting a video for "everyone" when only one group is leaving.Illustrative diagram of splitting the retention graph by audience segment. Step 6 — Fix one thing, then measure it on the next video What to do: Change one thing per video, wait two days, and compare the new graph against the grey band. How: Pick the first big drop on the graph and fix only that: a weak hook, a slow section, a confusing spike, or an ending that trails off. Re-record or cut that part, publish, wait for the 1–2 day processing window, then open the Engagement tab and compare the new line with the grey band. YouTube's own recommendations for improving intros are simple: change the thumbnail and title to better reflect the video content, and modify the first 30 seconds to find a style that keeps the audience interested. Example: A creator's intro holds 45%. They change only the first 10 seconds — stating the result before the setup — and the next video's intro holds 61%. Common mistake: Changing the hook, the thumbnail, the title and the edit all at once. Change one thing, measure, repeat.Illustrative diagram of the fix-one-thing-and-measure routine for retention. Checklist — Before You Publish☐ I opened the graph in Studio > Content > video > Analytics > Engagement ☐ I waited 1–2 days for the data to process ☐ I read all four labels: Intro, Top moments, Spikes, Dips ☐ I found the first big drop and watched the 15 seconds before it ☐ I compared the line with my own grey band, not a benchmark table ☐ I split the graph by new vs returning viewers ☐ I fixed one thing, and I will measure it on the next video ☐ I did not judge the video on day oneFAQs 1. Where is the audience retention graph in YouTube Studio? Go to Content, select a video, then Analytics, then the Engagement tab. YouTube's Help page says the report is only available at the video level — there is no channel-wide retention curve. 2. How long does retention data take to appear? YouTube says retention data typically takes 1–2 days to process. Key moments are only labelled on videos at least 60 seconds long with at least 100 views. 3. What does a spike in the retention graph mean? Spikes are moments viewers rewatched or shared. But YouTube also says a spike can mean the content was not clear and viewers had to rewatch it — check the comments at that timestamp before you treat it as a win. 4. What is a good audience retention rate? YouTube publishes no universal target. Compare each video against your own typical retention — your last 10 videos of similar length, shown as the grey band. 5. My retention graph has no labels — is it broken? No. YouTube says moments are only highlighted if they are detected, and only on videos 60 seconds or longer with 100+ views. A video with no labels is usually too new, too short, or too small to label yet. SourcesYouTube Help — "Measure key moments for audience retention" (official page, opened live 3 Nov 2026): https://support.google.com/youtube/answer/9314415?hl=en-IE&co=GENIE.Platform%3DiOS CreatorPlaybook — "YouTube CTR Suddenly Dropped After 24 Aug 2026? Engaged Views Explained": </blog/youtube-ctr-suddenly-dropped-after-24> CreatorPlaybook — "Audience Retention: How to Keep Viewers Watching": </blog/audience-retention-how-to-keep-viewers>