YouTube Thumbnail CTR Stuck at 2-3%? Test & Compare Explained (Watch Time, Not CTR)
 CreatorPlaybook Team
- 03 Nov, 2026
Your video has a 2.4% click-through rate, and every guide you read says that is terrible. So you change the thumbnail, the number moves to 2.6%, you change it again, and nothing really changes. The problem is not only the thumbnail — it is the way you are measuring it.
A 2-3% CTR is not necessarily broken. YouTube’s own Help pages say half of all channels and videos sit between 2% and 10% impressions CTR, and the number moves more with traffic source than with niche. The question is not “is 2-3% bad” but “can I prove a better thumbnail would do more?” YouTube has a built-in tool for exactly that — Test & Compare, also called A/B testing — and most creators use it wrong.
What You Will Learn
- Why 2-3% CTR is often normal, and when it is a real problem
- What Test & Compare is, and who is eligible
- Why the winner is chosen by watch time, not clicks
- How to set up a test in five steps
- The three results a test can give, and what each one means
- The mistakes that stall or invalidate a test
Step 1 — Check whether 2-3% is actually a problem
What to do: Compare the video against its own traffic source and your own channel, not against a number from a guide.
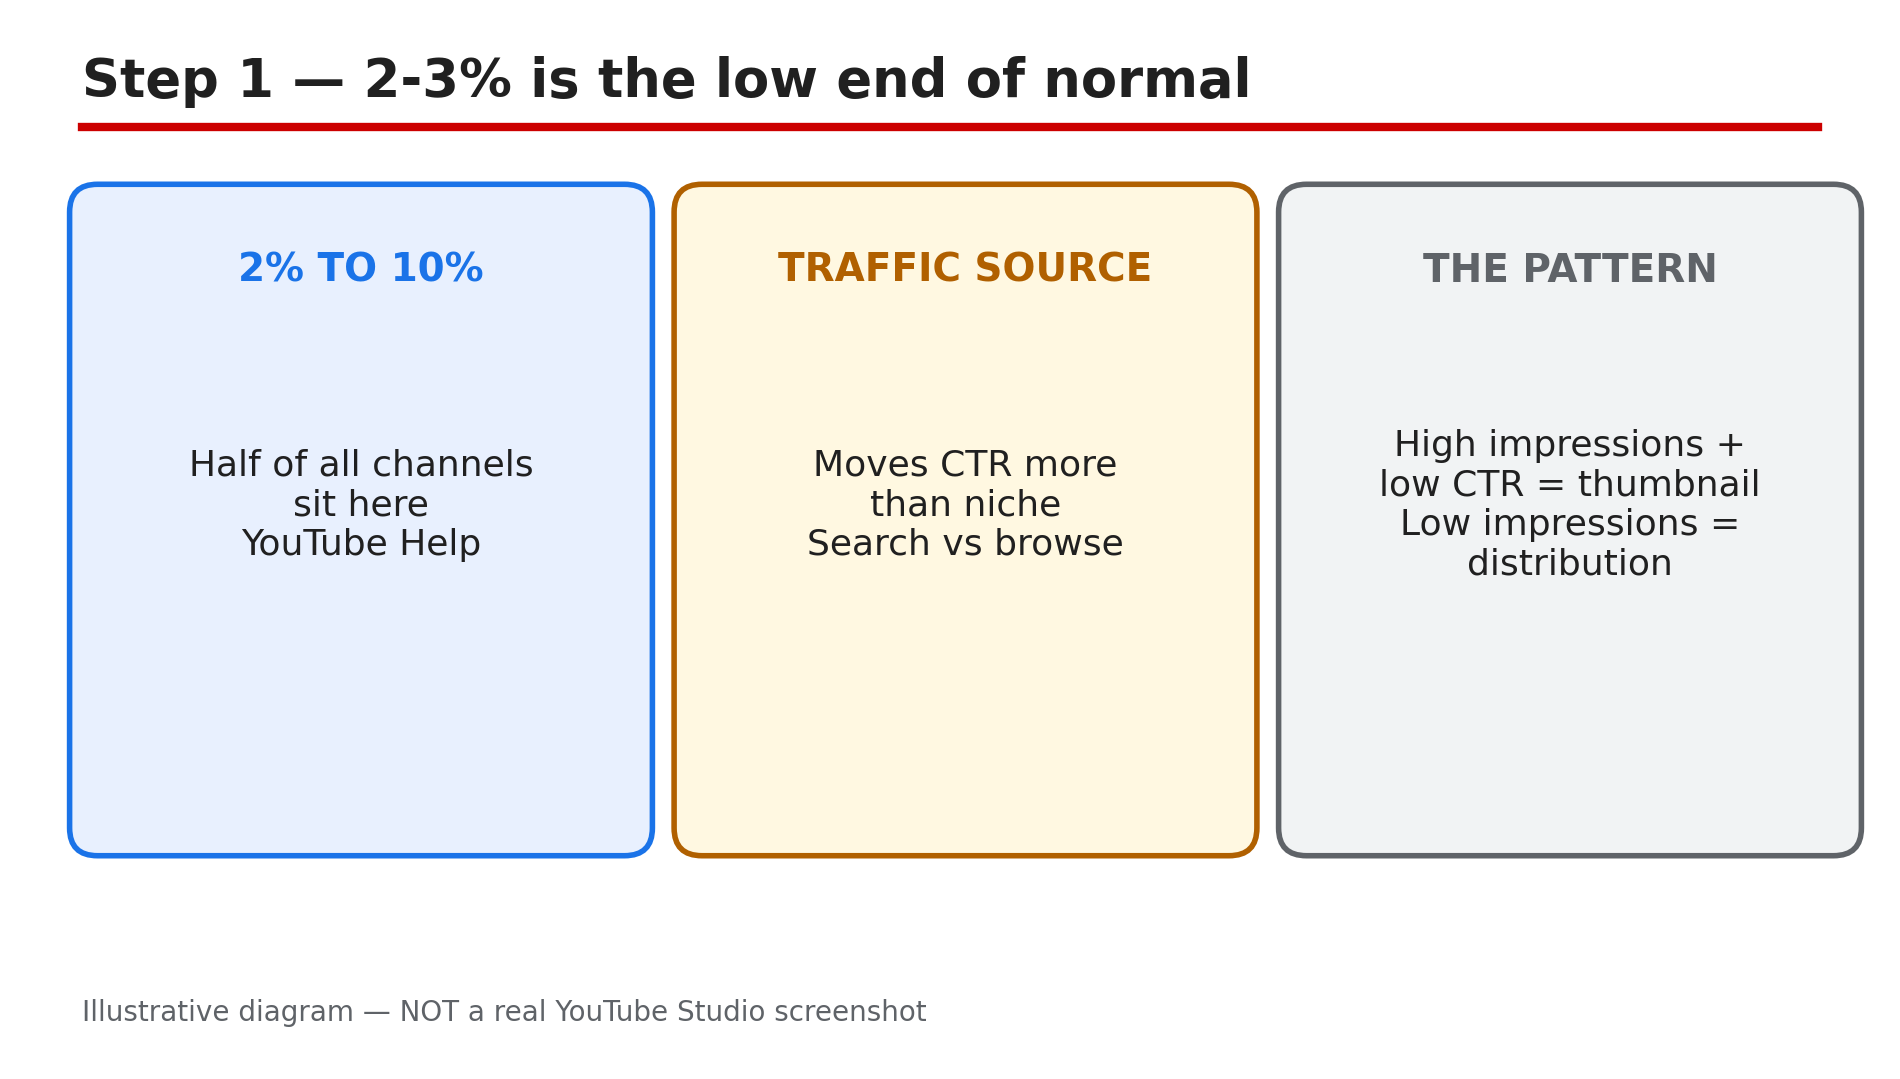
How: Open YouTube Studio, go to Analytics, then the Reach tab, and look at the video’s impressions and CTR together with its traffic sources. YouTube’s Help pages say half of all channels sit between 2% and 10% impressions CTR, so 2-3% is at the low end of normal. What matters more is the pattern: a video with high impressions and low CTR has a thumbnail or title problem; a video with low impressions has a distribution problem, and no thumbnail will fix that.
Example: A tutorial gets 40,000 impressions from search at 2.1% CTR and 800 views, while a similar video gets 5,000 impressions from browse at 8% CTR and 400 views. The first video is not broken — search viewers are pickier.
Common mistake: Treating 2-3% as a fault on every video. A 2% CTR on 100,000 impressions is 2,000 viewers; a 9% CTR on 1,000 impressions is 90.
Illustrative diagram showing why a 2-3% CTR is often normal.
Step 2 — Learn what Test & Compare actually measures
What to do: Understand the one rule that changes everything: the winner is chosen by watch time, not by clicks.
How: YouTube’s Help page “A/B test titles & thumbnails” says creators can test and compare up to three different titles and thumbnails, and at the end of the test, the title or combination with the highest watch time is shown to all viewers. That is deliberate. A thumbnail that wins clicks but loses viewers in fifteen seconds is worse than a quieter thumbnail that brings in viewers who stay — YouTube says it optimises tests for overall watch time rather than click-through rate.
Example: Thumbnail A gets a 6% CTR and an average view duration of 40 seconds. Thumbnail B gets a 4% CTR and an average view duration of 3 minutes. Thumbnail B wins, because its viewers watched far longer.
Common mistake: Judging the test by CTR while it runs. Studio shows impressions and CTR during the test, and it is tempting to call a winner early. Wait for the watch-time verdict.
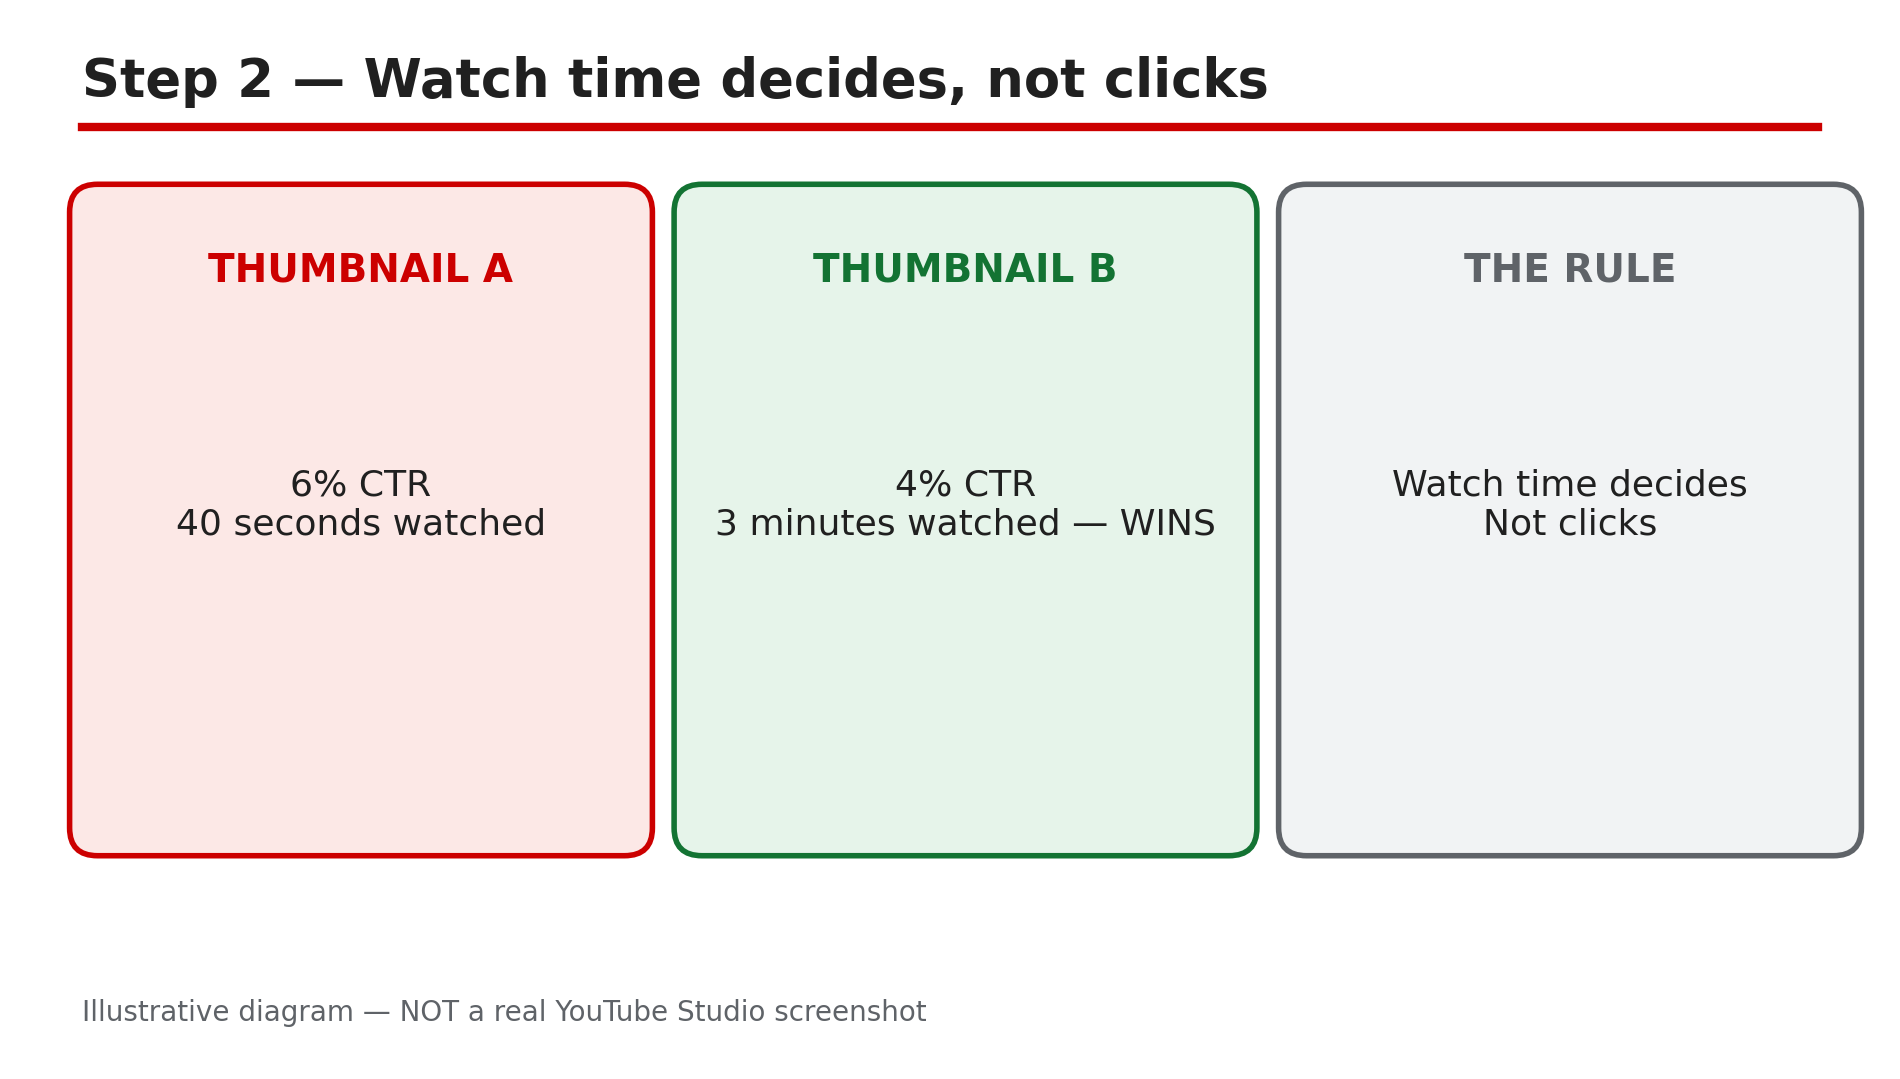
Illustrative diagram of why Test & Compare picks its winner by watch time.
Step 3 — Check that you can use the tool
What to do: Confirm eligibility before you plan a test, because the tool silently excludes whole categories of video.
How: YouTube’s Help page lists the requirements. Test & Compare is currently only available on computers through YouTube Studio — not the mobile app. You need advanced features enabled on your channel. And it does not work on Shorts, scheduled live streams, or Premiere videos — though a Premiere becomes eligible after it ends. You also cannot use it on videos that are Made for Kids, age-restricted, or private.
Example: A creator opens a Short in Studio on their phone and finds no A/B Testing button. Nothing is broken — Shorts cannot be A/B tested, and the tool is desktop-only.
Common mistake: Assuming the feature is broken or not rolled out to you. Check the device first — desktop Studio only — then the video type, then whether advanced features are enabled.
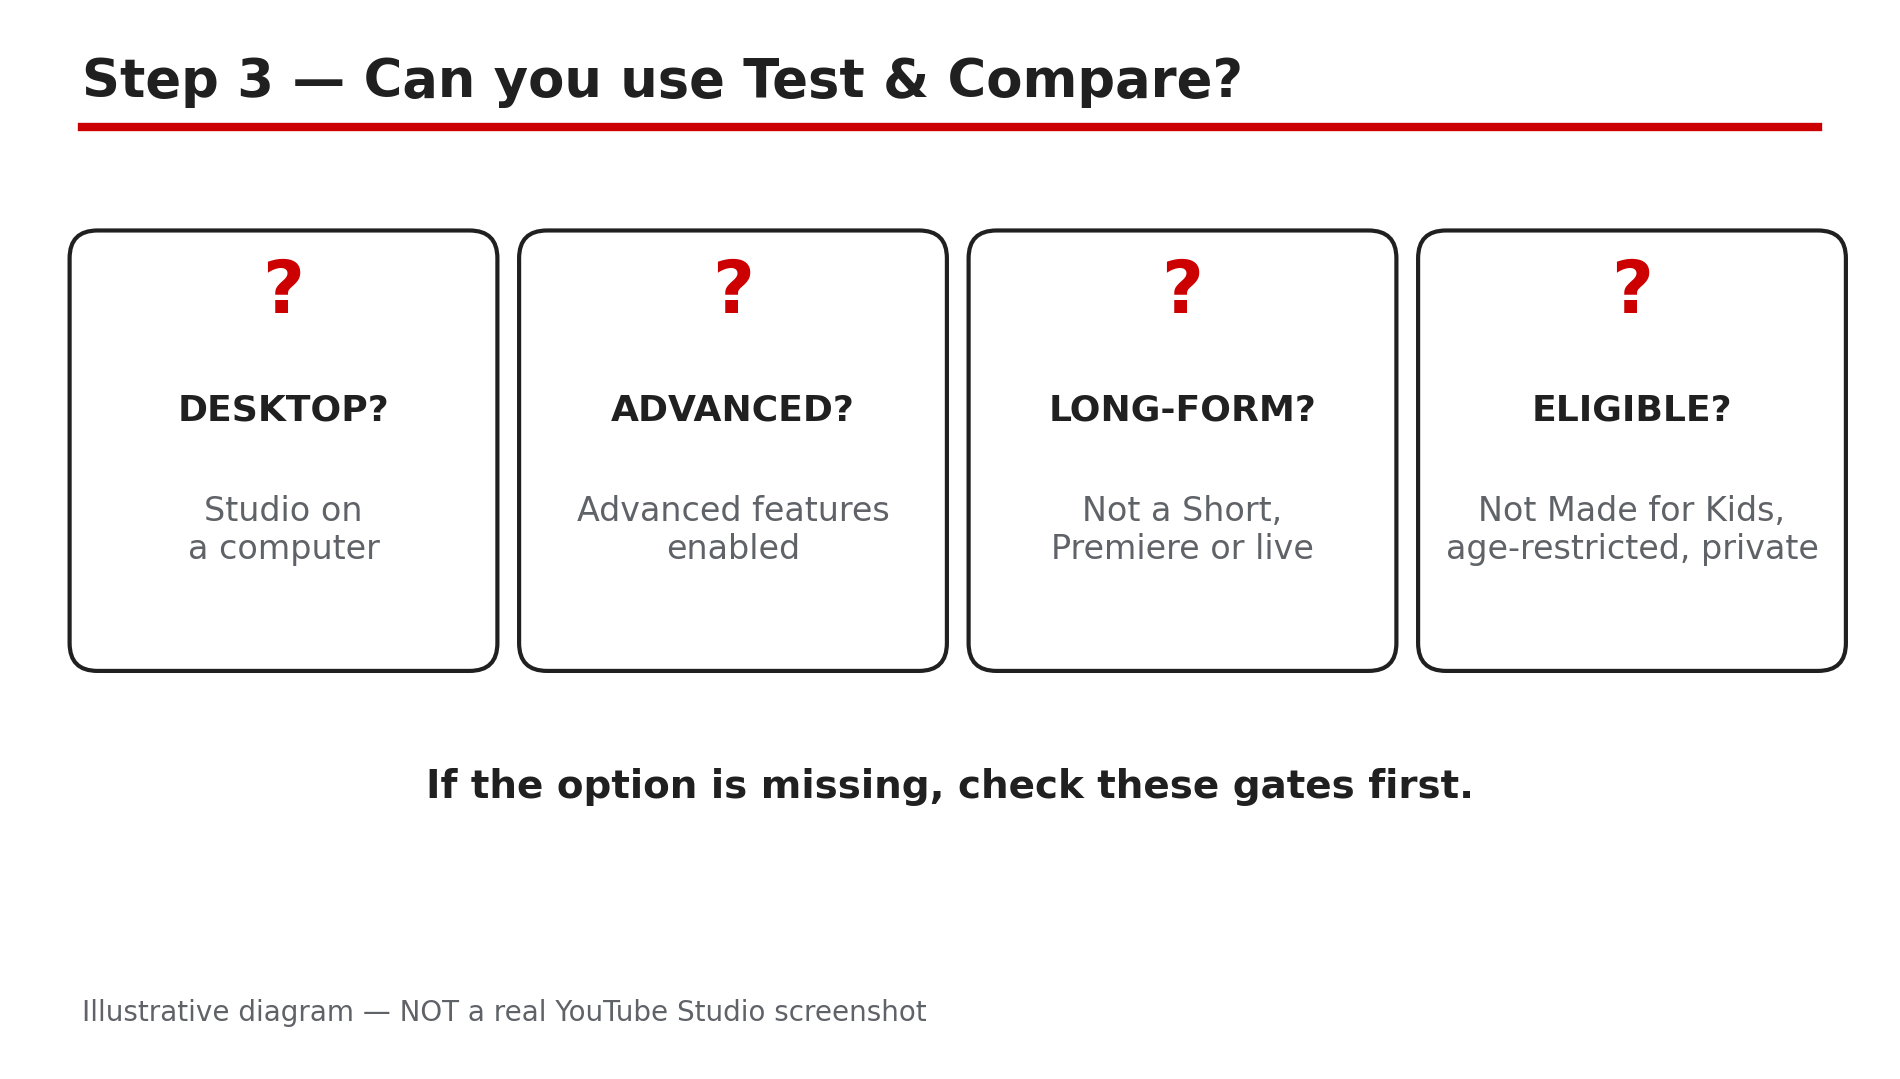
Illustrative diagram of the eligibility checks for Test & Compare.
Step 4 — Set up a test that can actually answer
What to do: Test one clear idea at a time, with three genuinely different options.
How: In YouTube Studio on a computer, open the video, and in the Title box or under Thumbnail, click A/B Testing. Choose one of three test types: Title only, Thumbnail only, or Title and thumbnail together. Upload up to three thumbnails or titles and click Done. YouTube runs the combinations evenly across your viewers for up to two weeks. The key discipline is to change one meaningful variable: the same image with three different text treatments — no text, two or three bold words, a short question — tells you whether words on the image matter at all.
Example: A creator tests three thumbnails for a budgeting video: no text, the words “SAVE $1,000”, and the question “Where does your money go?” After two weeks, the question version wins on watch time.
Common mistake: Testing three thumbnails that differ only in background colour, or changing the title halfway through. YouTube says that if a video’s title or thumbnail is changed during the test, the test automatically stops.
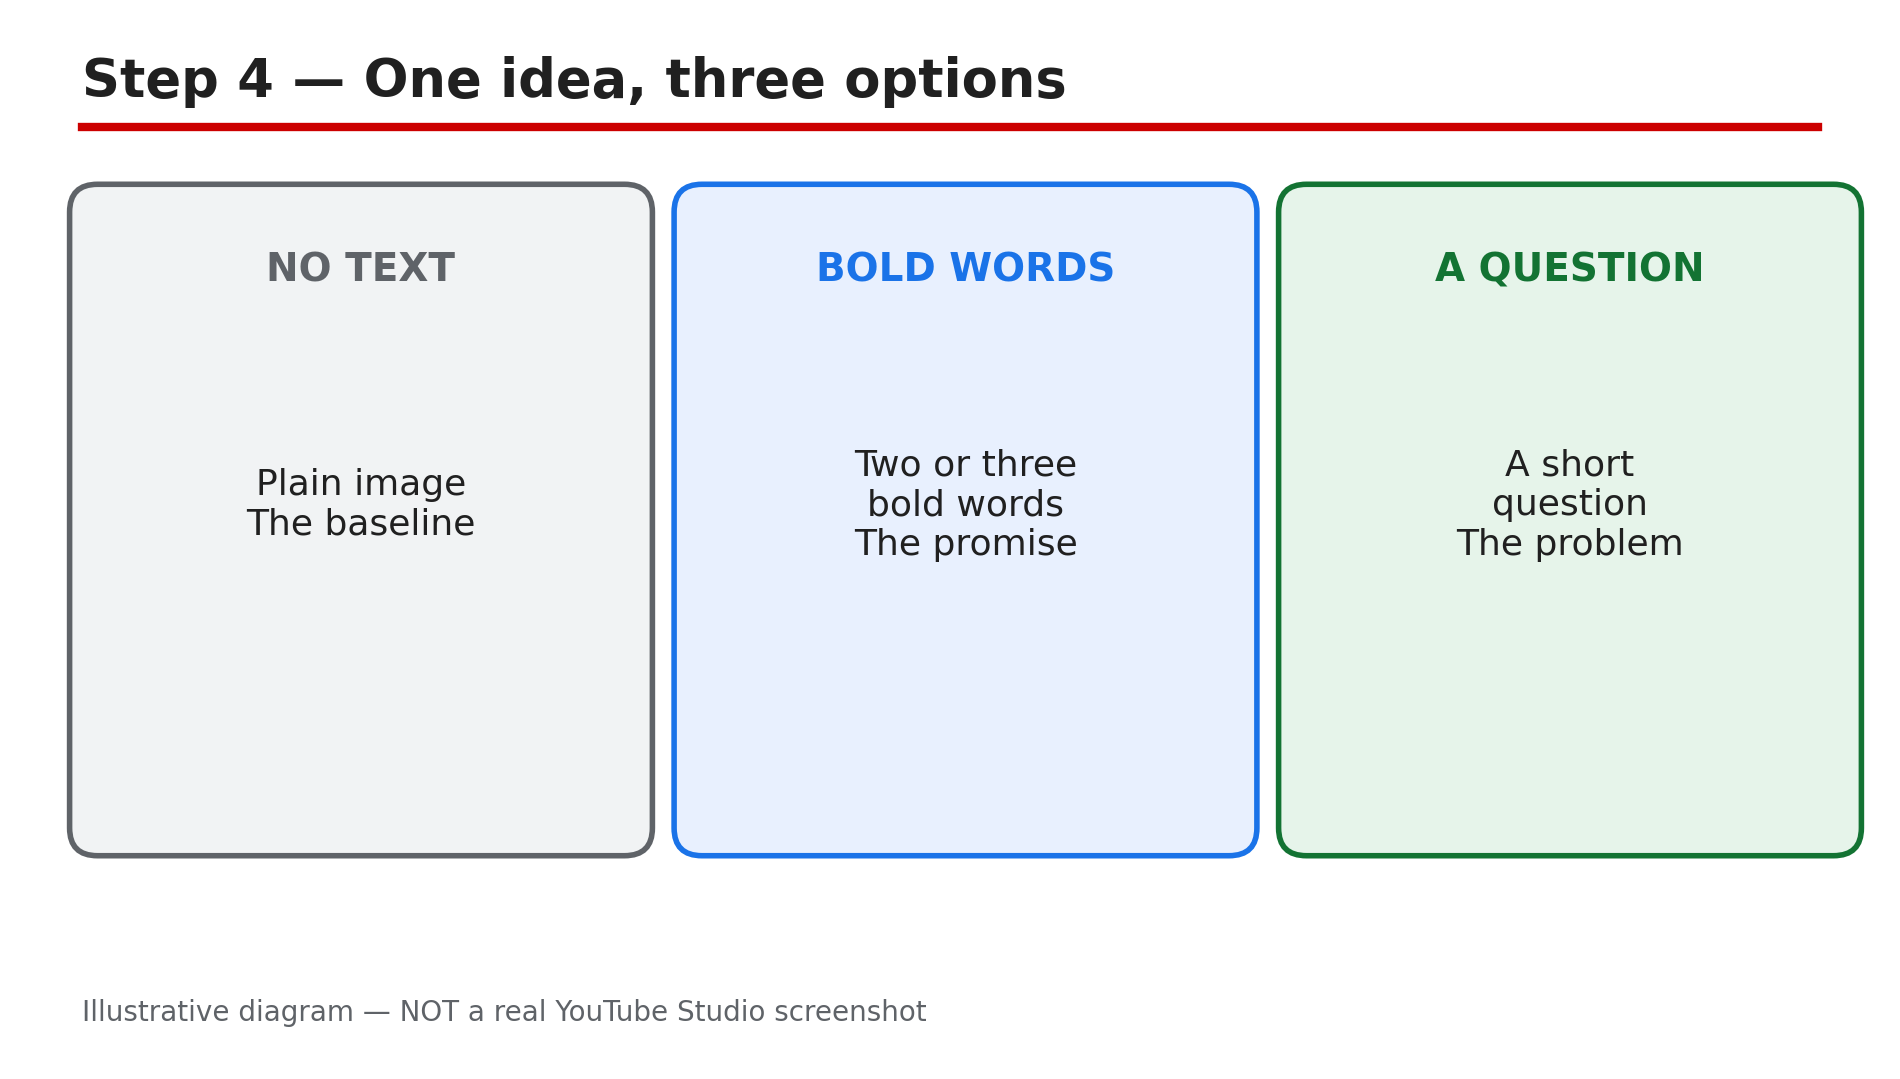
Illustrative diagram of a good first thumbnail test with three different options.
Step 5 — Read the result, including “no winner”
What to do: Open the result in Analytics and act on whichever of the three outcomes you get.
How: In Analytics, open the Reach tab, and under “How your A/B test is going” choose Manage test. YouTube reports one of three outcomes. “Winner” means one version was significantly better at driving watch time per impression, and YouTube applies it automatically. “Performed same” means all options earned a similar share of watch time — keep whichever you like. “Inconclusive” usually means the video did not get enough impressions to separate the options: a video with 2,000 impressions a week gives each variant very little data. If there is no clear winner, the first title or thumbnail you uploaded stays as the default.
Example: A test on a video with 1,500 impressions a week ends inconclusive after two weeks. The creator runs the next test on a video with 20,000 impressions a week.
Common mistake: Reading “inconclusive” as “my thumbnails are all bad”. Inconclusive is usually a sample-size problem — run the test where the audience is.
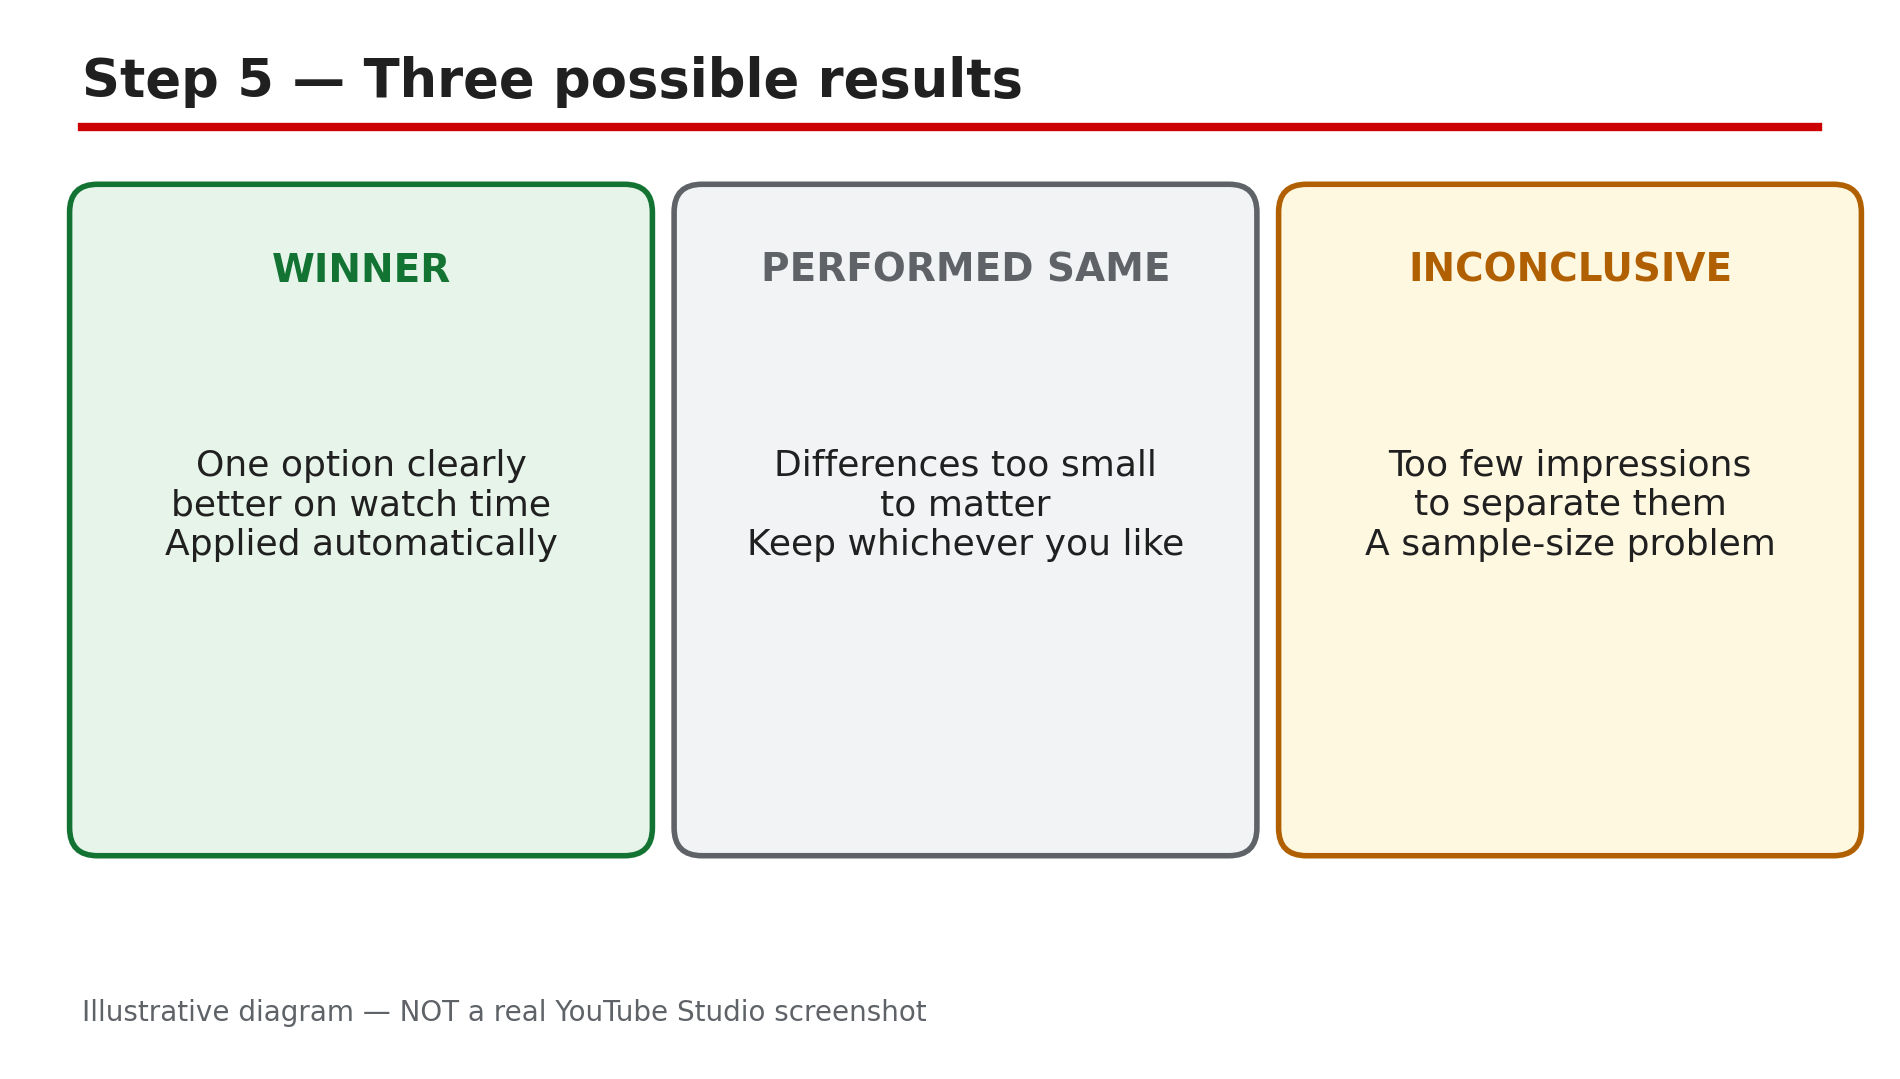
Illustrative diagram of the three results a Test & Compare test can give.
Step 6 — Turn one test into a repeatable habit
What to do: Keep a short log of what you tested and what won, and test your next videos the same way.
How: After each test, write down three things: what you varied, which option won, and what the audience’s watch time said about it. Over five or six tests a pattern appears — your audience may respond to faces, questions, or plain images — and that pattern is worth more than any single test. Test on videos that already have impressions, because a test needs data to decide.
Example: After six tests, a creator’s log shows question thumbnails won four times and no-text thumbnails won twice, always on watch time. They stop testing colours and start testing questions.
Common mistake: Testing once, getting a winner, and never testing again. One test is one video’s answer. The habit is what compounds.
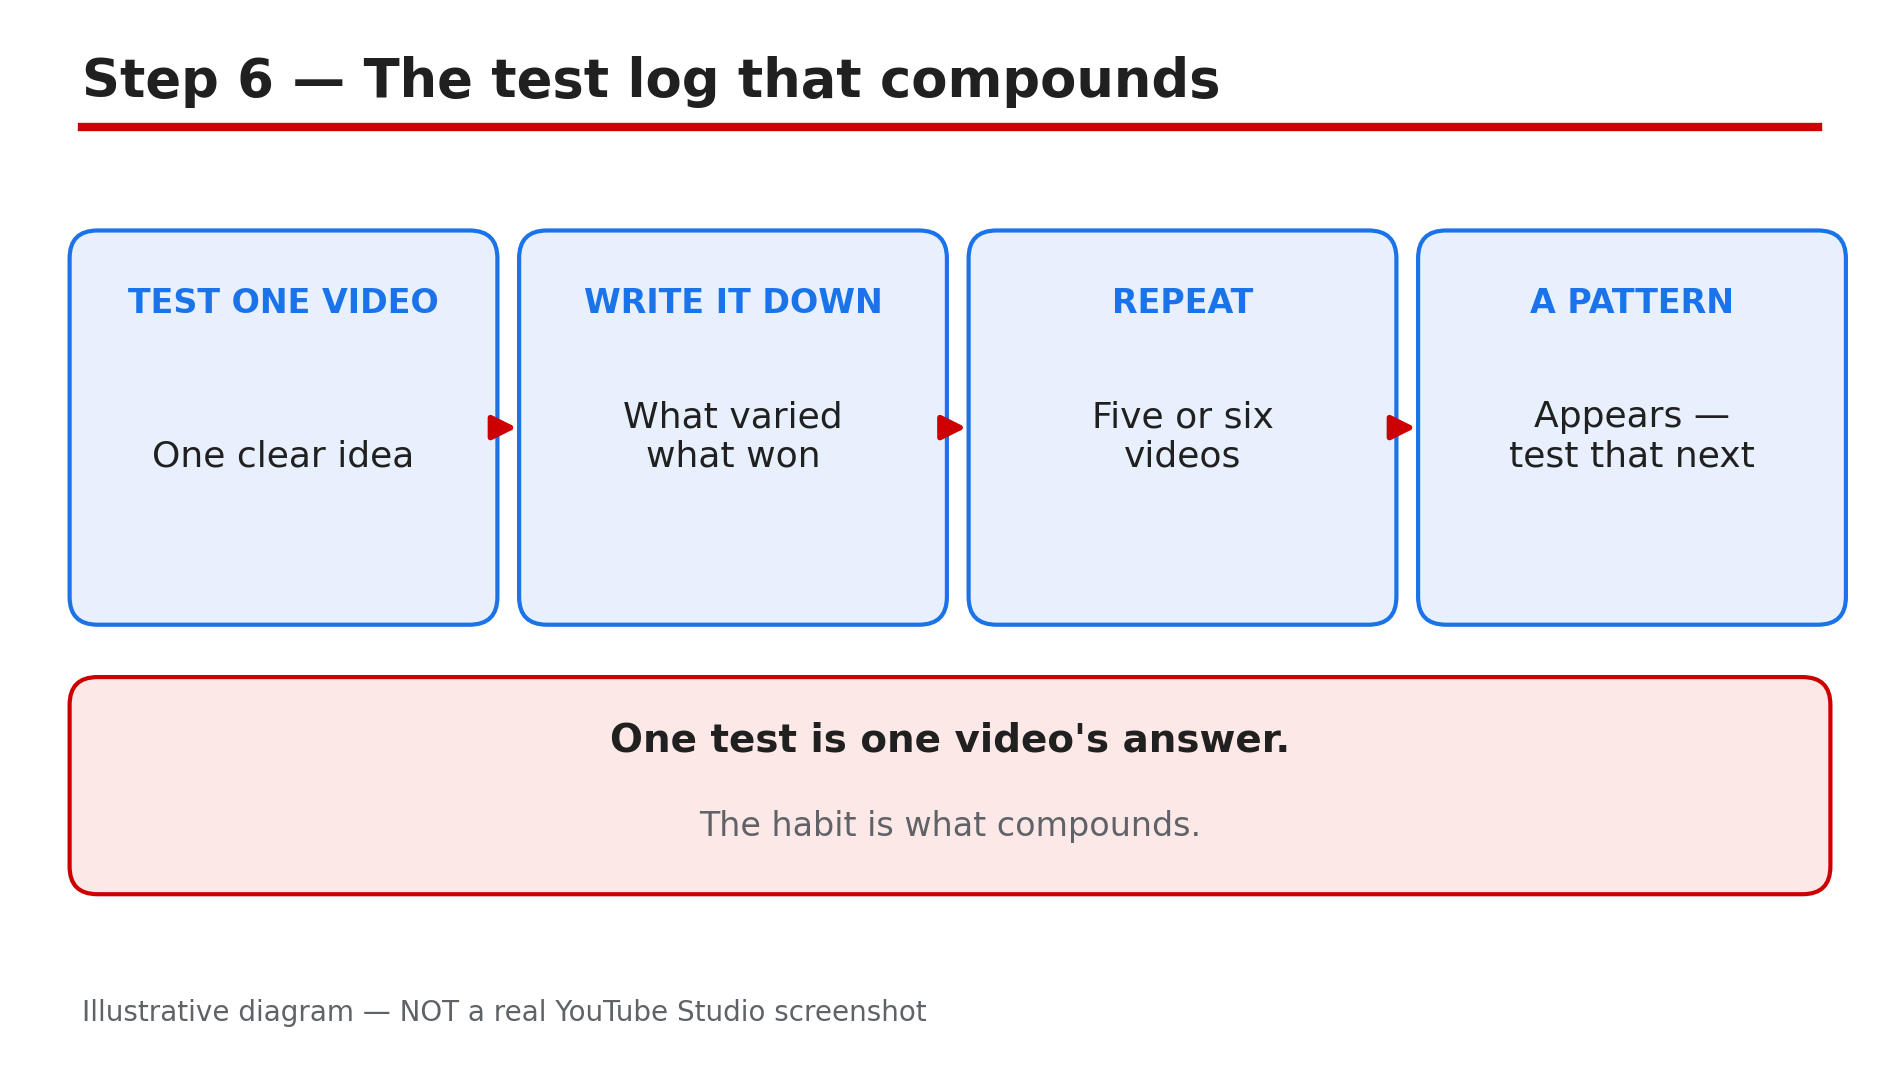
Illustrative diagram of turning single tests into a repeatable testing habit.
Checklist — Before You Publish
- ☐ I checked the video’s traffic source before calling 2-3% a problem
- ☐ I know the winner is chosen by watch time, not CTR
- ☐ I confirmed desktop Studio, advanced features, and an eligible video type
- ☐ I chose one test type: title only, thumbnail only, or both
- ☐ I uploaded up to three genuinely different options at 1280 x 720
- ☐ I did not change the title or thumbnail while the test runs
- ☐ I read the result in Analytics > Reach > Manage test
- ☐ I logged what won, so the next test starts smarter
FAQs
1. Is a 2-3% CTR bad on YouTube?
Not necessarily. YouTube’s Help pages say half of all channels sit between 2% and 10% impressions CTR, and traffic source moves the number more than niche does. Check impressions and traffic source first.
2. Does Test & Compare pick the winner by CTR?
No. YouTube’s Help page says the option with the highest watch time is shown to all viewers at the end of the test. A thumbnail can win clicks and still lose, if its viewers leave quickly.
3. Can I A/B test a Shorts thumbnail?
No. YouTube’s Help page says you cannot A/B test Shorts, scheduled live streams, or Premiere videos until they end. It also does not work on Made for Kids, age-restricted, or private videos, and it is only available on a computer.
4. How long does a test take?
Your test should be completed within two weeks. If it ends inconclusive, the video usually did not get enough impressions — the first title or thumbnail you uploaded stays as the default.
5. What happens if I change the thumbnail during a test?
YouTube says the test automatically stops, and you have to restart it. Leave the title and thumbnail alone until the test ends.
Sources
- YouTube Help — “A/B test titles & thumbnails” (official page, opened live 3 Nov 2026): https://support.google.com/youtube/answer/16391400
- CreatorPlaybook — “YouTube Custom Thumbnail Rejected or Not Showing? How to Fix It”: </blog/youtube-custom-thumbnail-rejected-or>
- CreatorPlaybook — “YouTube CTR Suddenly Dropped After 24 Aug 2026? Engaged Views Explained”: </blog/youtube-ctr-suddenly-dropped-after-24>