Showing Posts From
Youtube analytics
 CreatorPlaybook Team
- 05 Nov, 2026
YouTube Realtime Views Stuck? Why the Counter Freezes and What to Do
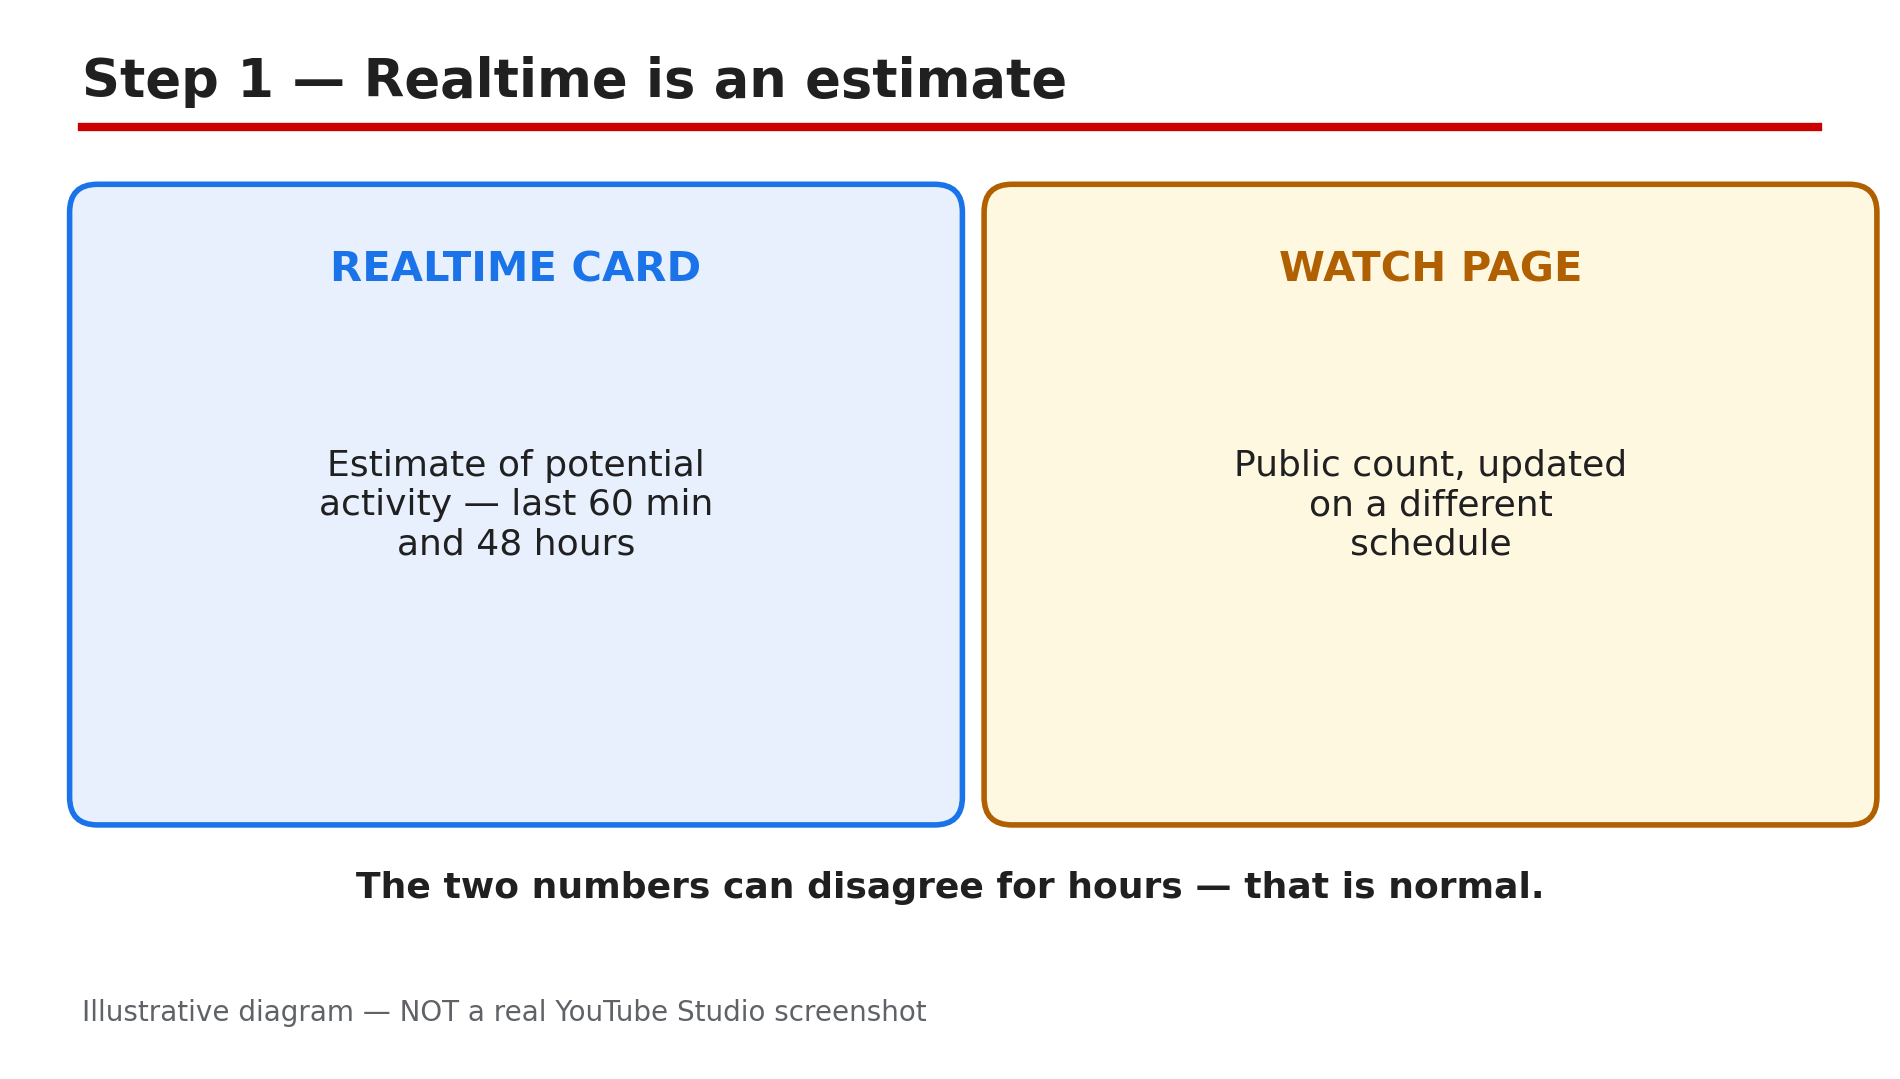
You published a video, friends tell you they watched it — but the Realtime counter in YouTube Studio has not moved for hours. The first instinct is to assume something is broken. Most of the time it is not. YouTube's Realtime report is an estimate, not a final count, and YouTube deliberately slows, freezes or even changes the public counter while it checks that the playbacks behind it are real. This guide explains what the counter shows, how long a freeze can last, and how to tell a normal lag from a real distribution problem. What You Will LearnWhat the Realtime report measures, and why it is only an estimate Why YouTube freezes or changes a view count while it verifies playbacks How the 24 August 2026 view-counting change affects what you see Why replaying your own video does not move the counter How to tell a verification lag from a video that is not being shown to anyone What a view count going backwards meansStep 1 — Realtime is an estimate, not the final count What to do: Before you panic, learn what the number on your screen actually is. How: In Studio, go to Analytics and look at the Realtime card. YouTube's Help page, "How engagement metrics are counted", says Realtime activity only shows estimates of potential view activity, and it might not match the number on the watch page. The card covers roughly the last 60 minutes and the last 48 hours, and those figures are provisional. The two can disagree for hours because they update on different schedules. A frozen Realtime number with a slowly rising watch-page count is normal — the estimate is lagging, not the video. Example: A creator uploads at 6 pm, sees 42 views on the watch page at 9 pm, but the Realtime card still shows 18. Both catch up by morning. Common mistake: Treating the Realtime card as the official count and refreshing it every few minutes.Illustrative diagram showing why the Realtime estimate and the watch-page count can differ. Step 2 — Expect a slow start in the first few hours What to do: Give a new upload time before you judge the counter. How: YouTube's Help page states that it may take time for your metrics to appear in the system during the first few hours after your video is published. The timing varies with a video's popularity. Verified metrics can take several days to fully update in your Earn tab milestones. If your video is only a few hours old, the verification pipeline most likely has not caught up yet — check again after 24 hours. Example: A tutorial shows 30 views at noon and 400 by the next morning, most of the jump happening overnight as verified numbers land. Common mistake: Deleting the video and re-uploading a few hours later — that resets every counter to zero and restarts the wait.Illustrative diagram of how view counts normally appear in the first hours after publishing. Step 3 — Understand why YouTube freezes a count on purpose What to do: Learn the freeze mechanism so you stop reading it as a bug. How: YouTube wants its metrics to come from actual humans, not computer programs. To verify that metrics are accurate, it may temporarily slow down, freeze or change your metric count, and discard low-quality playbacks. "Low-quality playback" is YouTube's own term — its example is watching the same video on several devices, or streaming it across several windows and tabs. Those playbacks are removed, which is why the number can stay still — or even go down — while real people are watching. YouTube publishes no refresh deadline: the timing varies by video. The old "301 views freeze" is not a current rule — it was removed in 2015. Example: A video jumps to 120 views, freezes for a day, then moves to 180 — the pause was YouTube confirming the first wave, not a penalty. Common mistake: Buying views or asking a group chat to loop the video — those are exactly the playbacks YouTube discards. Illustrative diagram of how YouTube verifies playbacks before counting them.Step 4 — Know what changed on 24 August 2026 What to do: Update your idea of what a "view" is, because the old one is out of date. How: Beginning on 24 August 2026, YouTube counts a view the moment a video starts to play, across all formats — Shorts, long-form videos and live streams. The public count can therefore rise faster than it used to, which makes a freeze feel more alarming than it is: the counter fills up quickly, then pauses while playbacks are verified. Two things did not change. Partner Programme earnings are still based on engaged views and engaged watch hours, not the public view count, and YPP eligibility is still based on qualified views. A frozen public count does not mean your earnings are frozen. Example: A Short shows 5,000 public views but only 1,200 engaged views — the gap is the new counting rule working as designed. Common mistake: Treating a public-view milestone as a monetisation milestone.Illustrative diagram of the 24 August 2026 view-counting change and what it did not change. Step 5 — Stop testing the counter with your own replays What to do: Do not use your own devices to check whether the counter is working. How: The most common self-inflicted freeze is the creator replaying their own video on two phones, a laptop and a tablet, then watching the number refuse to move. YouTube names exactly this as a low-quality playback: using several devices to watch the same video, or streaming it across several windows and tabs. Those replays are discarded, so the test tells you nothing except that the filter works. The same applies to asking friends to loop the video, or refreshing the watch page yourself — none of it is counted, and a burst of it can trigger a longer pause. To see whether real viewers are reaching the video, look at traffic sources in Analytics instead. Example: A creator replays a new video ten times on two phones, sees the count stay at 7, and assumes the video is broken — while its search traffic the next day shows genuine viewers arriving normally. Common mistake: Treating your own replays as a test of the counter.Illustrative diagram of the self-replay habits that YouTube treats as low-quality playbacks. Step 6 — Tell a verification lag from a real distribution problem What to do: Use two simple tests to decide whether to wait or to act. How: First, look at the number itself. A counter that is frozen but non-zero, with views still trickling in over a day or two, is almost always verification lag — wait, and check the Earn tab milestones a few days later. A Short that is still at zero a full day after publishing, with no impressions in Analytics at all, is a different problem: the video is probably not being distributed. Check the basics in Studio — the video is Public (not Private or Unlisted by mistake), the audience setting is correct, and there is no restriction in the Restrictions column. Second, watch the direction of the count. A count that goes backwards is not a glitch: it means YouTube removed playbacks it decided were invalid. If the count keeps falling while real viewers say they watched, check traffic sources — a sudden loss of one source is a distribution issue, not a counting one. Example: A gaming Short sits at zero views after 24 hours — it was uploaded as Unlisted by mistake. Switching it to Public starts impressions within the hour. Common mistake: Waiting a week on a video that was never Public.Illustrative diagram for deciding whether a stuck counter is a verification lag or a distribution problem. Checklist — Before You Worry About a Stuck Realtime Counter☐ The video is at least 24 hours old — first-hours delays are normal ☐ I compared the Realtime card with the watch-page count, not just one of them ☐ I have not been replaying the video on my own devices or asking others to loop it ☐ The video is Public, with the right audience setting and no restriction in Studio ☐ A Short at zero after a day got a distribution check, not just a longer wait ☐ I know a small drop means invalid playbacks were removed, not a bug ☐ I checked traffic sources in Analytics instead of refreshing the counter ☐ I gave verified metrics several days before judging the Earn tabFAQs 1. Why are my YouTube Realtime views stuck? Realtime is an estimate. YouTube may slow down, freeze or change the count while it verifies playbacks are from real humans, and discards low-quality playbacks. 2. How long does a Realtime views freeze last? YouTube publishes no fixed deadline. Metrics may take time to appear in the first few hours, and verified metrics can take several days to fully update. A freeze of a day or two on a new video is usually normal. 3. Why did my view count go down? YouTube removes invalid or low-quality playbacks — for example, the same video watched on several devices or across several windows and tabs. A small drop after a spike is the filter working. 4. Does a frozen view count affect my YouTube earnings? No — Partner Programme earnings are based on engaged views and engaged watch hours, not the public view count. 5. My Short is still at zero views after a day — is that the same problem? Usually not. A frozen-but-non-zero count is normally verification lag, but a Short at zero after a day with no impressions points to a distribution problem — check the video is Public and the Restrictions column in Studio. SourcesYouTube Help — "How engagement metrics are counted" (official page, opened live 5 Nov 2026): https://support.google.com/youtube/answer/2991785?hl=en CreatorPlaybook — "YouTube Video Not Showing in Search? Diagnose It Step by Step": </blog/youtube-video-not-showing-in-search> CreatorPlaybook — "YouTube Channel Not Growing? Diagnose the 4 Real Reasons": </blog/youtube-channel-not-growing-diagnose-4>
- CreatorPlaybook Team
- 03 Nov, 2026
How to Read Your YouTube Retention Graph: Dips, Spikes and What to Fix First
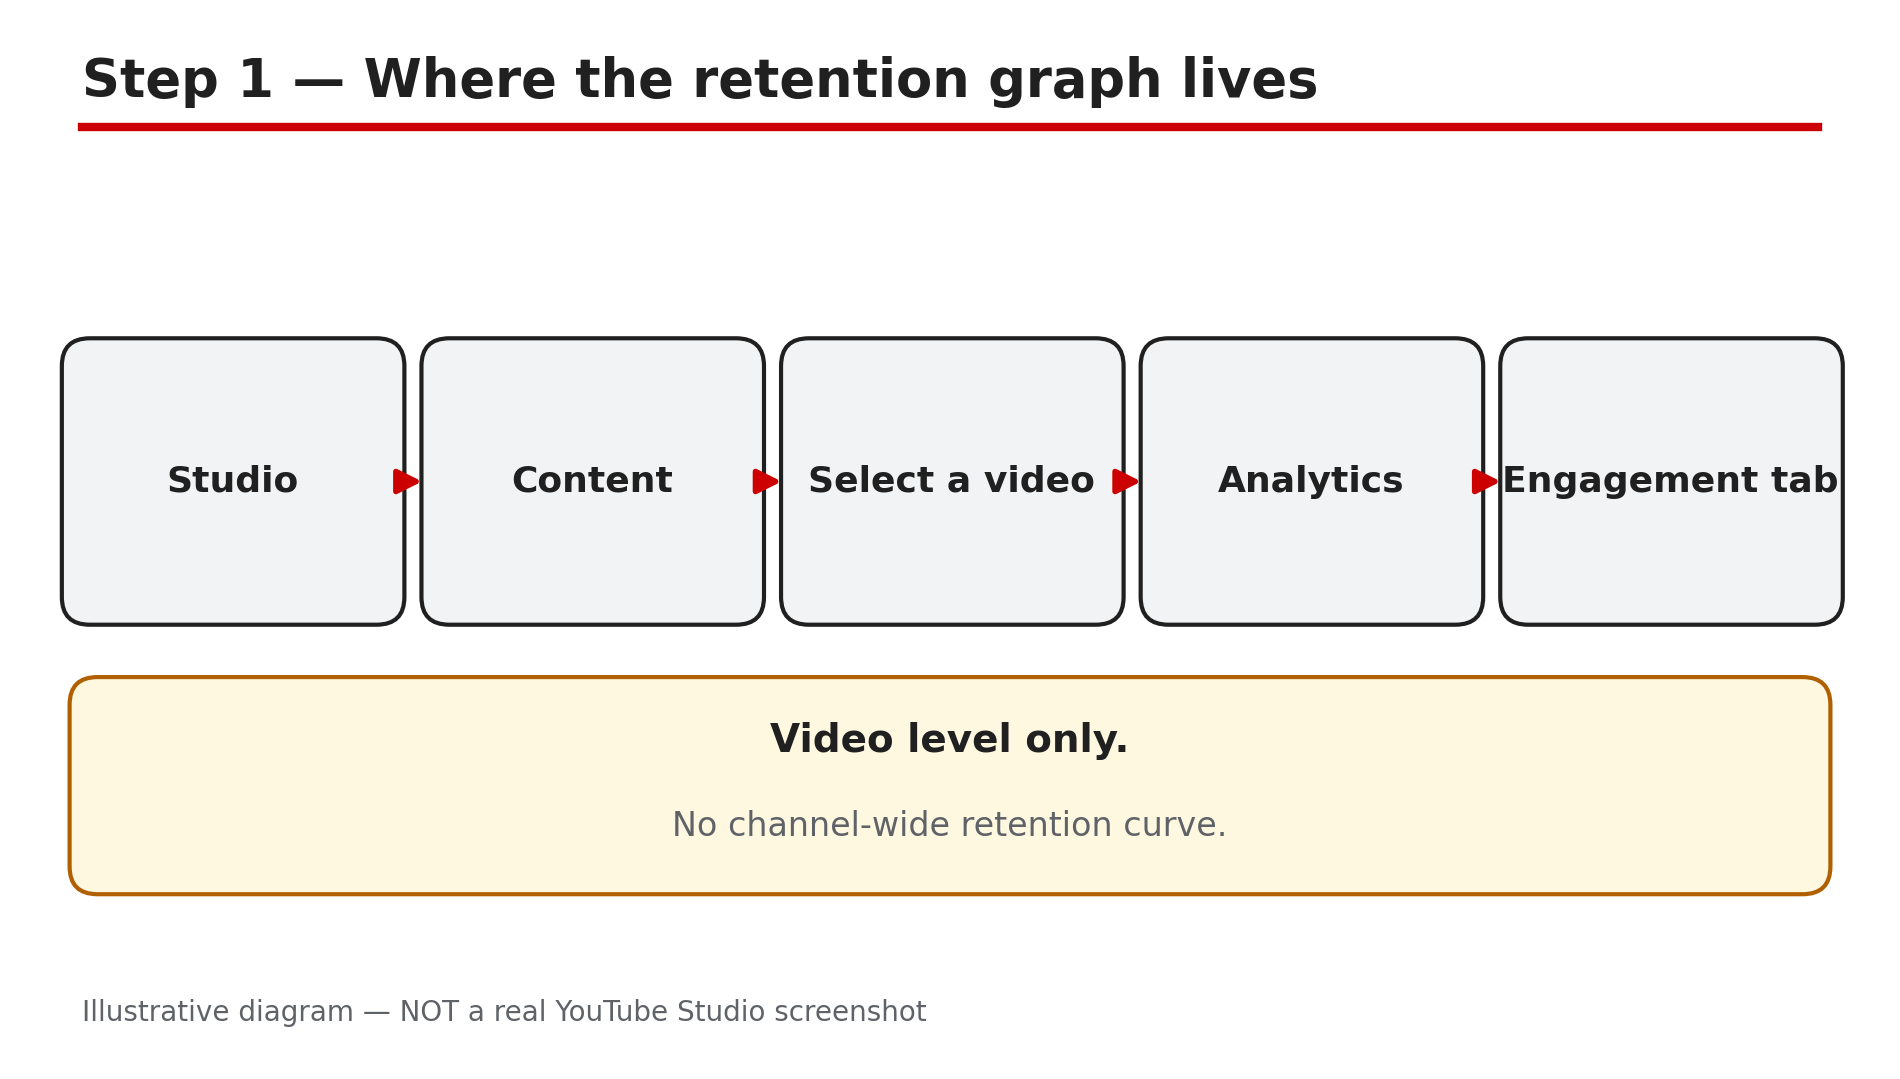
A thumbnail can lie. A title can over-promise. But the retention graph cannot lie: it shows, second by second, where real viewers decided your video was not worth more of their time. Every creator has stared at that falling line and wondered what to do about it — and most of them fix the wrong part. The graph is not one number. YouTube's Analytics labels four kinds of moments on it — Intro, Top moments, Spikes and Dips — and each one points at a different fix. A steep cliff in the first 30 seconds is a hook problem. A dip halfway through is a slow section to cut. This guide shows you where to find the graph, how to read each shape, and the order to fix things in. What You Will LearnWhere the retention graph lives in YouTube Studio The four key moments YouTube labels, and what each one means The four shapes that show up most, and the fix for each How to compare a video against your own typical retention Why there is no official retention target to chase The one mistake that makes a good graph look badStep 1 — Open the graph for one video, and wait for the data What to do: Open the retention report for a single video, and only trust it once the data has had time to process. How: In YouTube Studio, go to Content, select a video, then Analytics, then the Engagement tab. The audience retention report sits there. YouTube's Help page says the report explains how well different moments of your video held viewers' attention — but the data typically takes 1–2 days to process, and it is only available at the video level, not for the whole channel. Key moments are only labelled when YouTube detects them, and only on videos at least 60 seconds long with at least 100 views. Example: A creator checks a video two hours after publishing, sees a flat line at 20%, and panics. Two days later the same video shows a normal curve. Common mistake: Judging a video on day one. Wait at least two days for the data.Illustrative diagram of where to find the audience retention graph in YouTube Studio. Step 2 — Learn the four labels YouTube puts on the graph What to do: Learn the four official terms before you interpret anything, because each one means something specific. How: YouTube's Help page names four types of moments. Intro tells you what percentage of your audience still watched after the first 30 seconds — your hook's report card. Top moments are moments where almost no one dropped off. Spikes are moments that were rewatched or shared — but YouTube also warns that a spike can mean your content was not clear and the audience had to rewatch a section. Dips highlight moments that were skipped or where viewers stopped watching. YouTube also draws a grey band: your typical retention, from your last 10 videos of similar length. Example: A creator's graph shows an Intro of 62%, a Top moment at the worked example, a Spike at the price reveal, and a Dip at the sponsor read. Four labels, four different jobs — and only one is a problem. Common mistake: Treating every dip as a disaster and every spike as a triumph. A spike can be confusion.Illustrative diagram of the four key moments YouTube labels on the retention graph. Step 3 — Read the shape of the line, not just the number What to do: Match the shape of your curve to one of four patterns, and let the pattern choose the fix. How: The most common patterns are four. A steep early cliff in the first 30 seconds means the opening did not confirm what the title and thumbnail promised — fix the hook. A mid-video dip at one timestamp means a specific slow section — watch the 15 seconds before the drop, because the cause is usually just ahead of it, then cut or tighten that section. A gentle steady decline is normal: audiences shrink over the length of a video, and a slow slope is not a fault. A flat line means viewers are watching that section start to finish — that is the goal, not a problem. Example: A 10-minute video falls from 100% to 55% in the first 30 seconds, then declines gently to 40% by the end. The problem is entirely in the first 30 seconds. Common mistake: Re-editing the whole video when the graph shows one dip. Fix the first big drop first.Illustrative diagram of the four retention curve shapes and the fix for each. Step 4 — Compare against your own typical retention, not a benchmark table What to do: Judge each video against your own last 10 uploads of similar length, and ignore any table that claims YouTube has a target number. How: YouTube publishes no universal retention target. Its Help page says only that you can use typical retention to compare your 10 latest videos of similar length — and its Content tab tips add that videos with 50% or more of the audience still watching after the 30-second mark can be found in the "above typical intros" list. Third-party benchmark tables — the kind that say 30% is poor and 60% is excellent — are not YouTube's numbers. A 2025 study of 10,000+ videos reported average retention near 23.7% — a reported study figure, not a target. Example: A gaming channel's typical retention is 35% at the end of a 12-minute video. A new video ends at 42% — above its own grey band, a clear improvement. Common mistake: Chasing a magic number like "70% intro retention" that YouTube has never published.Illustrative diagram of comparing a video against its own typical retention. Step 5 — Split the graph by audience before you change anything What to do: Use the segments report to find out who is leaving, because the fix depends on which viewers drop off. How: YouTube's Help page says the audience retention segments report lets you compare new viewers against returning viewers, and subscribers against non-subscribers. If subscribers stay and new viewers leave early, your intro is speaking to insiders — it assumes knowledge a first-time viewer does not have. If returning viewers leave and new viewers stay, the video may be repeating something your regulars already know. Example: A channel's tutorial shows a dip at 2:00 for new viewers only — the section assumes the viewer knows the tool's menu layout. The creator adds a five-second orientation, and the dip disappears. Common mistake: Rewriting a video for "everyone" when only one group is leaving.Illustrative diagram of splitting the retention graph by audience segment. Step 6 — Fix one thing, then measure it on the next video What to do: Change one thing per video, wait two days, and compare the new graph against the grey band. How: Pick the first big drop on the graph and fix only that: a weak hook, a slow section, a confusing spike, or an ending that trails off. Re-record or cut that part, publish, wait for the 1–2 day processing window, then open the Engagement tab and compare the new line with the grey band. YouTube's own recommendations for improving intros are simple: change the thumbnail and title to better reflect the video content, and modify the first 30 seconds to find a style that keeps the audience interested. Example: A creator's intro holds 45%. They change only the first 10 seconds — stating the result before the setup — and the next video's intro holds 61%. Common mistake: Changing the hook, the thumbnail, the title and the edit all at once. Change one thing, measure, repeat.Illustrative diagram of the fix-one-thing-and-measure routine for retention. Checklist — Before You Publish☐ I opened the graph in Studio > Content > video > Analytics > Engagement ☐ I waited 1–2 days for the data to process ☐ I read all four labels: Intro, Top moments, Spikes, Dips ☐ I found the first big drop and watched the 15 seconds before it ☐ I compared the line with my own grey band, not a benchmark table ☐ I split the graph by new vs returning viewers ☐ I fixed one thing, and I will measure it on the next video ☐ I did not judge the video on day oneFAQs 1. Where is the audience retention graph in YouTube Studio? Go to Content, select a video, then Analytics, then the Engagement tab. YouTube's Help page says the report is only available at the video level — there is no channel-wide retention curve. 2. How long does retention data take to appear? YouTube says retention data typically takes 1–2 days to process. Key moments are only labelled on videos at least 60 seconds long with at least 100 views. 3. What does a spike in the retention graph mean? Spikes are moments viewers rewatched or shared. But YouTube also says a spike can mean the content was not clear and viewers had to rewatch it — check the comments at that timestamp before you treat it as a win. 4. What is a good audience retention rate? YouTube publishes no universal target. Compare each video against your own typical retention — your last 10 videos of similar length, shown as the grey band. 5. My retention graph has no labels — is it broken? No. YouTube says moments are only highlighted if they are detected, and only on videos 60 seconds or longer with 100+ views. A video with no labels is usually too new, too short, or too small to label yet. SourcesYouTube Help — "Measure key moments for audience retention" (official page, opened live 3 Nov 2026): https://support.google.com/youtube/answer/9314415?hl=en-IE&co=GENIE.Platform%3DiOS CreatorPlaybook — "YouTube CTR Suddenly Dropped After 24 Aug 2026? Engaged Views Explained": </blog/youtube-ctr-suddenly-dropped-after-24> CreatorPlaybook — "Audience Retention: How to Keep Viewers Watching": </blog/audience-retention-how-to-keep-viewers>
- CreatorPlaybook Team
- 03 Nov, 2026
YouTube Thumbnail CTR Stuck at 2-3%? Test & Compare Explained (Watch Time, Not CTR)
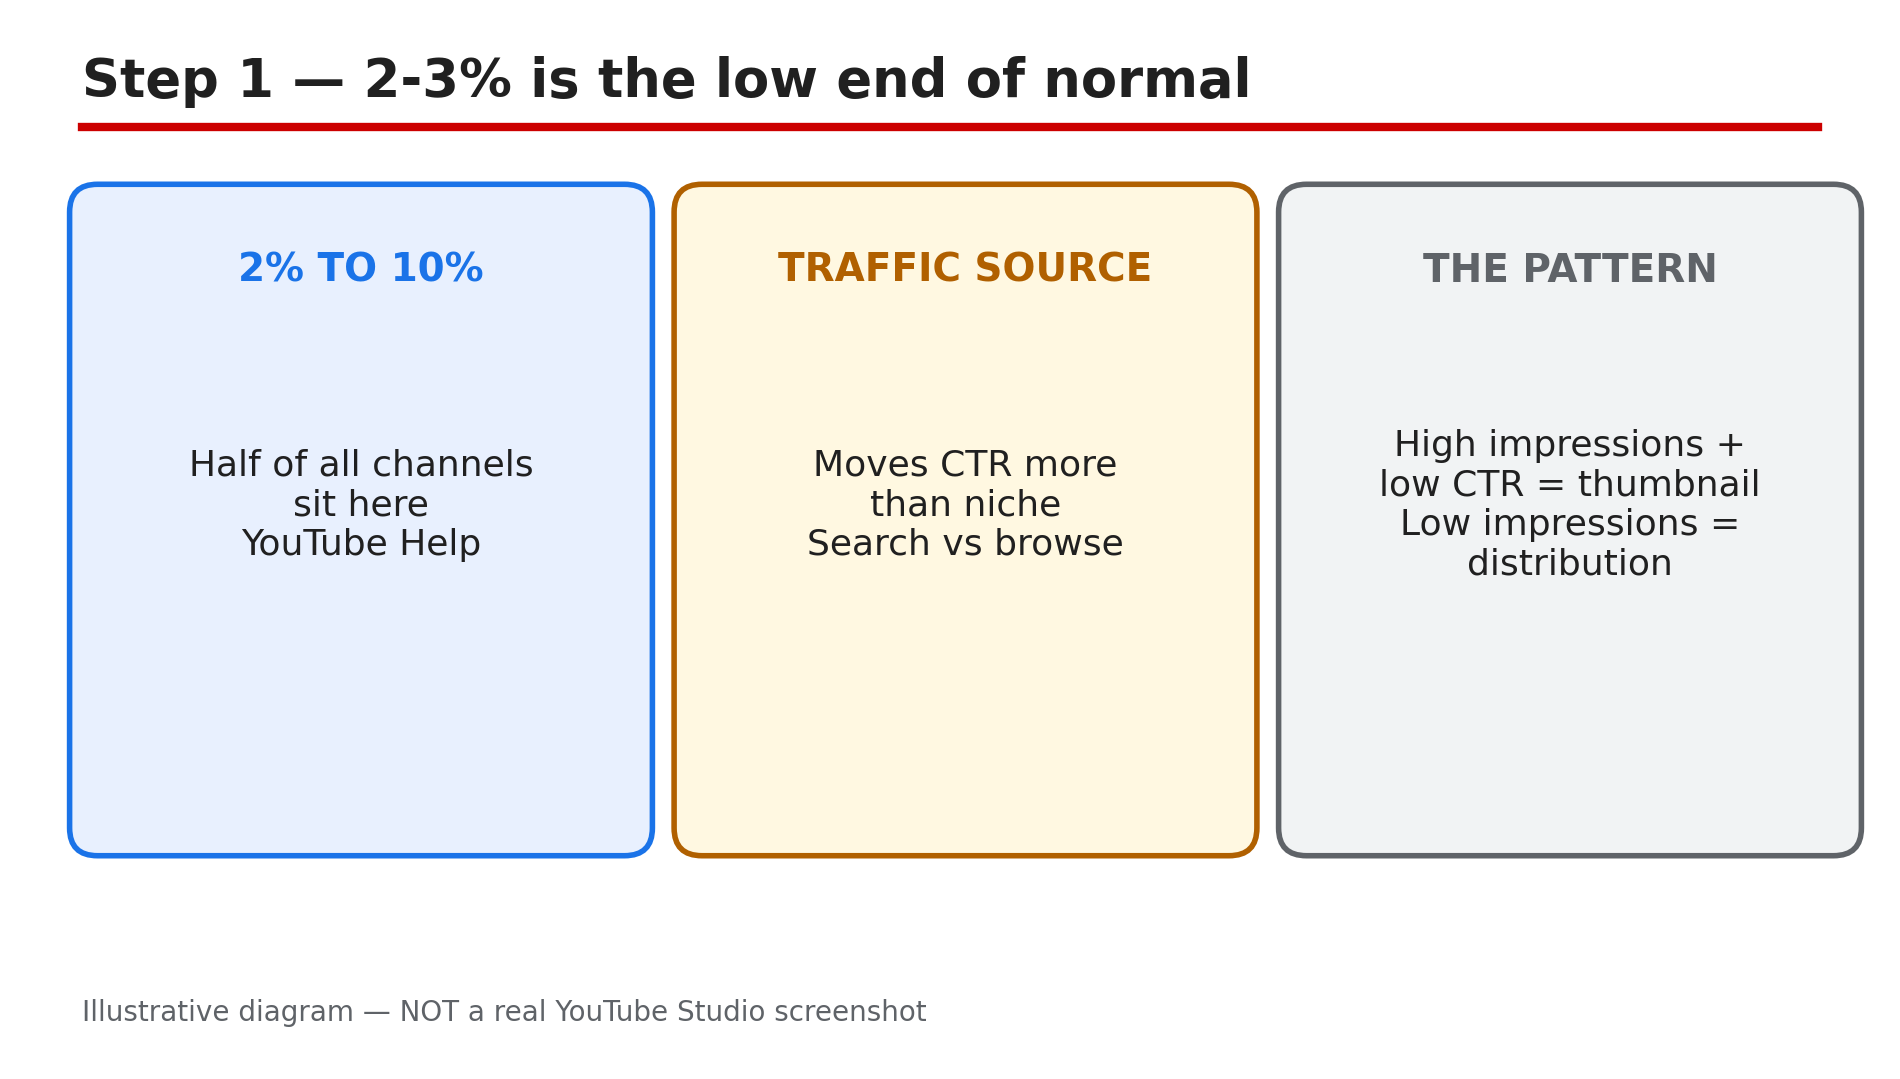
Your video has a 2.4% click-through rate, and every guide you read says that is terrible. So you change the thumbnail, the number moves to 2.6%, you change it again, and nothing really changes. The problem is not only the thumbnail — it is the way you are measuring it. A 2-3% CTR is not necessarily broken. YouTube's own Help pages say half of all channels and videos sit between 2% and 10% impressions CTR, and the number moves more with traffic source than with niche. The question is not "is 2-3% bad" but "can I prove a better thumbnail would do more?" YouTube has a built-in tool for exactly that — Test & Compare, also called A/B testing — and most creators use it wrong. What You Will LearnWhy 2-3% CTR is often normal, and when it is a real problem What Test & Compare is, and who is eligible Why the winner is chosen by watch time, not clicks How to set up a test in five steps The three results a test can give, and what each one means The mistakes that stall or invalidate a testStep 1 — Check whether 2-3% is actually a problem What to do: Compare the video against its own traffic source and your own channel, not against a number from a guide. How: Open YouTube Studio, go to Analytics, then the Reach tab, and look at the video's impressions and CTR together with its traffic sources. YouTube's Help pages say half of all channels sit between 2% and 10% impressions CTR, so 2-3% is at the low end of normal. What matters more is the pattern: a video with high impressions and low CTR has a thumbnail or title problem; a video with low impressions has a distribution problem, and no thumbnail will fix that. Example: A tutorial gets 40,000 impressions from search at 2.1% CTR and 800 views, while a similar video gets 5,000 impressions from browse at 8% CTR and 400 views. The first video is not broken — search viewers are pickier. Common mistake: Treating 2-3% as a fault on every video. A 2% CTR on 100,000 impressions is 2,000 viewers; a 9% CTR on 1,000 impressions is 90.Illustrative diagram showing why a 2-3% CTR is often normal. Step 2 — Learn what Test & Compare actually measures What to do: Understand the one rule that changes everything: the winner is chosen by watch time, not by clicks. How: YouTube's Help page "A/B test titles & thumbnails" says creators can test and compare up to three different titles and thumbnails, and at the end of the test, the title or combination with the highest watch time is shown to all viewers. That is deliberate. A thumbnail that wins clicks but loses viewers in fifteen seconds is worse than a quieter thumbnail that brings in viewers who stay — YouTube says it optimises tests for overall watch time rather than click-through rate. Example: Thumbnail A gets a 6% CTR and an average view duration of 40 seconds. Thumbnail B gets a 4% CTR and an average view duration of 3 minutes. Thumbnail B wins, because its viewers watched far longer. Common mistake: Judging the test by CTR while it runs. Studio shows impressions and CTR during the test, and it is tempting to call a winner early. Wait for the watch-time verdict.Illustrative diagram of why Test & Compare picks its winner by watch time. Step 3 — Check that you can use the tool What to do: Confirm eligibility before you plan a test, because the tool silently excludes whole categories of video. How: YouTube's Help page lists the requirements. Test & Compare is currently only available on computers through YouTube Studio — not the mobile app. You need advanced features enabled on your channel. And it does not work on Shorts, scheduled live streams, or Premiere videos — though a Premiere becomes eligible after it ends. You also cannot use it on videos that are Made for Kids, age-restricted, or private. Example: A creator opens a Short in Studio on their phone and finds no A/B Testing button. Nothing is broken — Shorts cannot be A/B tested, and the tool is desktop-only. Common mistake: Assuming the feature is broken or not rolled out to you. Check the device first — desktop Studio only — then the video type, then whether advanced features are enabled.Illustrative diagram of the eligibility checks for Test & Compare. Step 4 — Set up a test that can actually answer What to do: Test one clear idea at a time, with three genuinely different options. How: In YouTube Studio on a computer, open the video, and in the Title box or under Thumbnail, click A/B Testing. Choose one of three test types: Title only, Thumbnail only, or Title and thumbnail together. Upload up to three thumbnails or titles and click Done. YouTube runs the combinations evenly across your viewers for up to two weeks. The key discipline is to change one meaningful variable: the same image with three different text treatments — no text, two or three bold words, a short question — tells you whether words on the image matter at all. Example: A creator tests three thumbnails for a budgeting video: no text, the words "SAVE $1,000", and the question "Where does your money go?" After two weeks, the question version wins on watch time. Common mistake: Testing three thumbnails that differ only in background colour, or changing the title halfway through. YouTube says that if a video's title or thumbnail is changed during the test, the test automatically stops.Illustrative diagram of a good first thumbnail test with three different options. Step 5 — Read the result, including "no winner" What to do: Open the result in Analytics and act on whichever of the three outcomes you get. How: In Analytics, open the Reach tab, and under "How your A/B test is going" choose Manage test. YouTube reports one of three outcomes. "Winner" means one version was significantly better at driving watch time per impression, and YouTube applies it automatically. "Performed same" means all options earned a similar share of watch time — keep whichever you like. "Inconclusive" usually means the video did not get enough impressions to separate the options: a video with 2,000 impressions a week gives each variant very little data. If there is no clear winner, the first title or thumbnail you uploaded stays as the default. Example: A test on a video with 1,500 impressions a week ends inconclusive after two weeks. The creator runs the next test on a video with 20,000 impressions a week. Common mistake: Reading "inconclusive" as "my thumbnails are all bad". Inconclusive is usually a sample-size problem — run the test where the audience is.Illustrative diagram of the three results a Test & Compare test can give. Step 6 — Turn one test into a repeatable habit What to do: Keep a short log of what you tested and what won, and test your next videos the same way. How: After each test, write down three things: what you varied, which option won, and what the audience's watch time said about it. Over five or six tests a pattern appears — your audience may respond to faces, questions, or plain images — and that pattern is worth more than any single test. Test on videos that already have impressions, because a test needs data to decide. Example: After six tests, a creator's log shows question thumbnails won four times and no-text thumbnails won twice, always on watch time. They stop testing colours and start testing questions. Common mistake: Testing once, getting a winner, and never testing again. One test is one video's answer. The habit is what compounds.Illustrative diagram of turning single tests into a repeatable testing habit. Checklist — Before You Publish☐ I checked the video's traffic source before calling 2-3% a problem ☐ I know the winner is chosen by watch time, not CTR ☐ I confirmed desktop Studio, advanced features, and an eligible video type ☐ I chose one test type: title only, thumbnail only, or both ☐ I uploaded up to three genuinely different options at 1280 x 720 ☐ I did not change the title or thumbnail while the test runs ☐ I read the result in Analytics > Reach > Manage test ☐ I logged what won, so the next test starts smarterFAQs 1. Is a 2-3% CTR bad on YouTube? Not necessarily. YouTube's Help pages say half of all channels sit between 2% and 10% impressions CTR, and traffic source moves the number more than niche does. Check impressions and traffic source first. 2. Does Test & Compare pick the winner by CTR? No. YouTube's Help page says the option with the highest watch time is shown to all viewers at the end of the test. A thumbnail can win clicks and still lose, if its viewers leave quickly. 3. Can I A/B test a Shorts thumbnail? No. YouTube's Help page says you cannot A/B test Shorts, scheduled live streams, or Premiere videos until they end. It also does not work on Made for Kids, age-restricted, or private videos, and it is only available on a computer. 4. How long does a test take? Your test should be completed within two weeks. If it ends inconclusive, the video usually did not get enough impressions — the first title or thumbnail you uploaded stays as the default. 5. What happens if I change the thumbnail during a test? YouTube says the test automatically stops, and you have to restart it. Leave the title and thumbnail alone until the test ends. SourcesYouTube Help — "A/B test titles & thumbnails" (official page, opened live 3 Nov 2026): https://support.google.com/youtube/answer/16391400 CreatorPlaybook — "YouTube Custom Thumbnail Rejected or Not Showing? How to Fix It": </blog/youtube-custom-thumbnail-rejected-or> CreatorPlaybook — "YouTube CTR Suddenly Dropped After 24 Aug 2026? Engaged Views Explained": </blog/youtube-ctr-suddenly-dropped-after-24>
- CreatorPlaybook Team
- 31 Oct, 2026
YouTube CTR Suddenly Dropped After the 24 August 2026 View-Counting Change: What Happened and How to Fix It
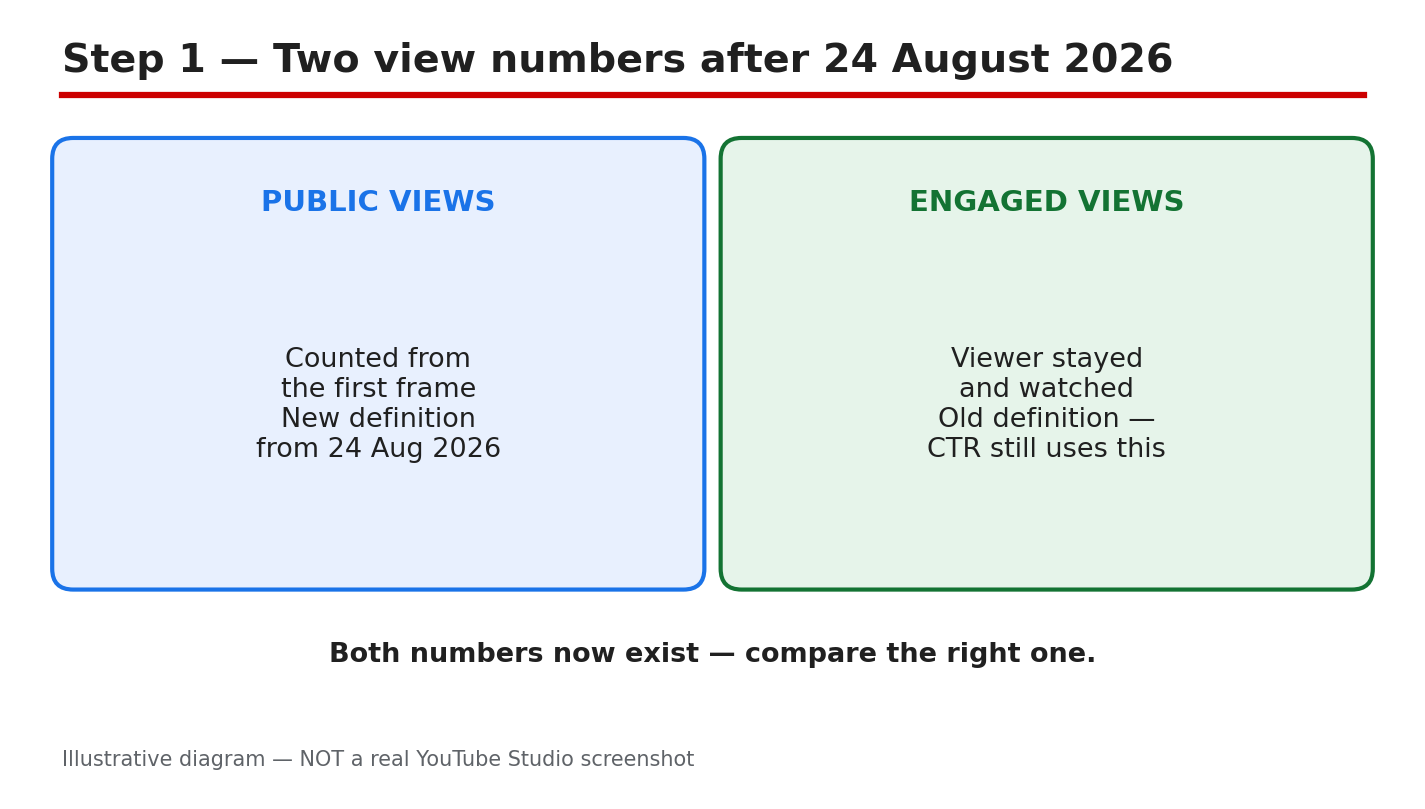
Your CTR looked fine in July, then fell sharply in late August 2026 — and you changed nothing. Before you blame your thumbnails, check the calendar. As reported, YouTube changed how it counts public views from 24 August 2026: a view now counts the moment a video starts to play, across long-form, live, and podcasts. The old, stricter definition did not disappear — it lives on in Studio as “engaged views”. That switch can make ratios that use views fall overnight, even when your channel did nothing wrong. This guide explains what changed, and how to fix the real problems. What you will learnWhat the reported 24 August 2026 change changed, and what it did not How to check in Studio whether your CTR really fell How to split a CTR drop by traffic source How to fix a real CTR problem with packaging and openingsStep 1: Understand what actually changed on 24 August 2026 What to do: Learn the two view numbers before you read any chart. How to do it: As reported, from 24 August 2026 a public view counts the moment a video starts to play, on every format. Before that, a long-form view was reported to need a viewer who chose to keep watching. The old rule was renamed “engaged views” and kept in Analytics. As reported, CTR, average view duration, and retention still use engaged views. Example: A tutorial shows 10,000 public views but only 6,000 engaged views — “playback started” versus “the viewer stayed”. Common mistake: Quoting a seconds threshold as fact because a blog said so — check the Help page instead.Illustrative diagram (mock-up) comparing the two view counts — not a real YouTube Studio screenshot. Step 2: Check whether your CTR really fell, in Studio What to do: Compare the same metric over equal periods on both sides of 24 August 2026. How to do it: In Studio, open Analytics, pick a video, and open the Reach tab. Look at impressions, click-through rate, and views together — never CTR alone. Compare equal periods, such as the 28 days before 24 August with the 28 days after it, using engaged views instead of public views. If your Studio CTR is steady, the drop is measurement, not performance. Example: A creator’s Studio CTR holds at 4.5%, but likes per public view fall by a third. The channel is fine. Common mistake: Comparing a 28-day Analytics total with a lifetime public count. Different ranges produce a false drop.Illustrative diagram (mock-up) — not a real YouTube Studio screenshot. Step 3: Split the fall by traffic source What to do: Break the CTR drop down by where viewers found the video. How to do it: In the Reach tab, open the traffic source report and look at CTR separately for Search, Browse, Suggested videos, and the Shorts feed. Search usually has the highest CTR; Browse usually has the lowest. As reported, feed surfaces produce many public views but far fewer engaged views, because autoplay can start a public view without a real choice to watch. If the fall sits in Browse while Search CTR is steady, blame the wider, lower-intent audience. Example: A how-to video keeps 7% CTR from Search but drops from 5% to 3% from Browse as impressions double — expanding reach, not failure. Common mistake: Averaging all traffic sources into one number and fixing the wrong thing.Illustrative diagram (mock-up) — not a real YouTube Studio screenshot. Step 4: Fix the packaging if the CTR problem is real What to do: If Studio CTR fell within one traffic source, fix the thumbnail and title first. How to do it: Pick the video with the most impressions and the lowest CTR in its source, and test one change at a time. Make the thumbnail readable at phone size: one main subject, strong contrast, four words or fewer. Make the title specific — topic, benefit, one honest detail — with the main keyword near the start. Then use Test & Compare in Studio, where available, and wait one to two weeks. Example: A creator changes only the thumbnail on a 2%-CTR video; after two weeks, CTR rises to 4%. Common mistake: Changing the thumbnail, title, description, and tags all on the same day.Illustrative diagram (mock-up) — not a real YouTube Studio screenshot. Step 5: Fix the first seconds so clicks become engaged views What to do: Make sure viewers who click stay past the first few seconds. How to do it: Open the Engagement tab and look at the retention curve for the first 30 seconds. If many viewers leave in the first seconds, the opening is the problem, not the thumbnail. State the promise of the title in the first five seconds, show the result early, and cut any long greeting or intro. Match the opening to the thumbnail exactly: if it shows a finished result, open with that result on screen. Example: A tutorial opens with 20 seconds of greeting and loses half its viewers in 10 seconds; moving the result to the first frame fixes it. Common mistake: Treating a CTR fix as complete when clicks rise but retention falls.Illustrative diagram (mock-up) — not a real YouTube Studio screenshot. Step 6: Set a fair baseline and track the recovery What to do: Build a fresh baseline from engaged views. How to do it: Write down, for your last five uploads, the engaged views, Studio CTR by traffic source, and average view duration, all from the same 28-day window after 24 August. That is your new normal. Check it weekly, on the same day, and judge a video against your own recent uploads, not a universal “good CTR” number. If engaged views and CTR hold steady on the new baseline, the August fall was measurement. Example: A creator’s baseline is 4% CTR from Search. A new video gets 3.8% — no alarm; another gets 1.5% — new thumbnail time. Common mistake: Panicking over one slow day and rewriting every thumbnail. One day of data is noise.Illustrative diagram (mock-up) — not a real YouTube Studio screenshot. Checklist☐ Know public views vs engaged views after 24 August 2026 ☐ Compared Studio CTR and engaged views over equal periods either side of the change ☐ Split the CTR drop by traffic source before fixing anything ☐ Tested one packaging change at a time on the lowest-CTR video ☐ Fixed the opening so clicks become engaged views; checked “stayed to watch” ☐ Recorded a new post-change baseline; check it weeklyFrequently asked questions Did YouTube change how views are counted on 24 August 2026? As reported, yes: from 24 August 2026 a public view is counted the moment a video starts to play, across long-form, live, and podcasts. The old definition continues as “engaged views” in Studio. Why did my CTR drop if the algorithm did not change? As reported, CTR in Analytics is still calculated on engaged views, and recommendations were reported as unchanged. What often falls is a ratio you calculate yourself using public views — the denominator grew overnight, so the ratio falls even if clicks stayed the same. Check the Studio CTR, not a home-made ratio. Does the view-counting change affect my earnings or Partner Program eligibility? As reported, no: earnings and eligibility are still based on engaged views and engaged watch hours, not the public count. What is a good CTR after the change? There is no single good number. As reported, half of all channels and videos sit between 2% and 10% CTR. Compare your videos with your own recent uploads, within the same traffic source. Should I change all my thumbnails because CTR dropped? No. First check whether the Studio CTR actually fell within one traffic source. If it did, test one new thumbnail on the highest-impression, lowest-CTR video and measure it over one to two weeks. SourcesYouTube Help: Decoding CTR & impressions in your Analytics How YouTube Counts Views in 2026: Public Views vs Engaged Views Explained How to Improve Click-Through RateNo official YouTube video is embedded here: none was verified live in this run. Change dates and figures are reported claims — confirm them in Studio.