How YouTube Counts Views in 2026: Public Views vs Engaged Views Explained
 CreatorPlaybook Team
- 29 Oct, 2026
Two videos can show the same view count and earn very different amounts. That gap confuses many creators, because YouTube shows more than one kind of view. The number under a video and the number that counts for earnings are not always the same, and treating them as one number leads to wrong conclusions.
This guide separates the two numbers, shows where to find each one in YouTube Studio, and explains the reported change to how views are counted. It also gives you a short weekly check, so you can read your numbers without guessing. Where a date or a change is reported, this guide says so, and points you to the official Help page for the current definition.
What You Will Learn
- The difference between public views and engaged views.
- Where to see the split in YouTube Studio Analytics.
- The reported view-counting change, and what to check officially.
- How to read traffic source, retention, and date ranges correctly.
- Why views and earnings differ, and what a 7-day check looks like.
Related reading: Understanding YouTube Analytics
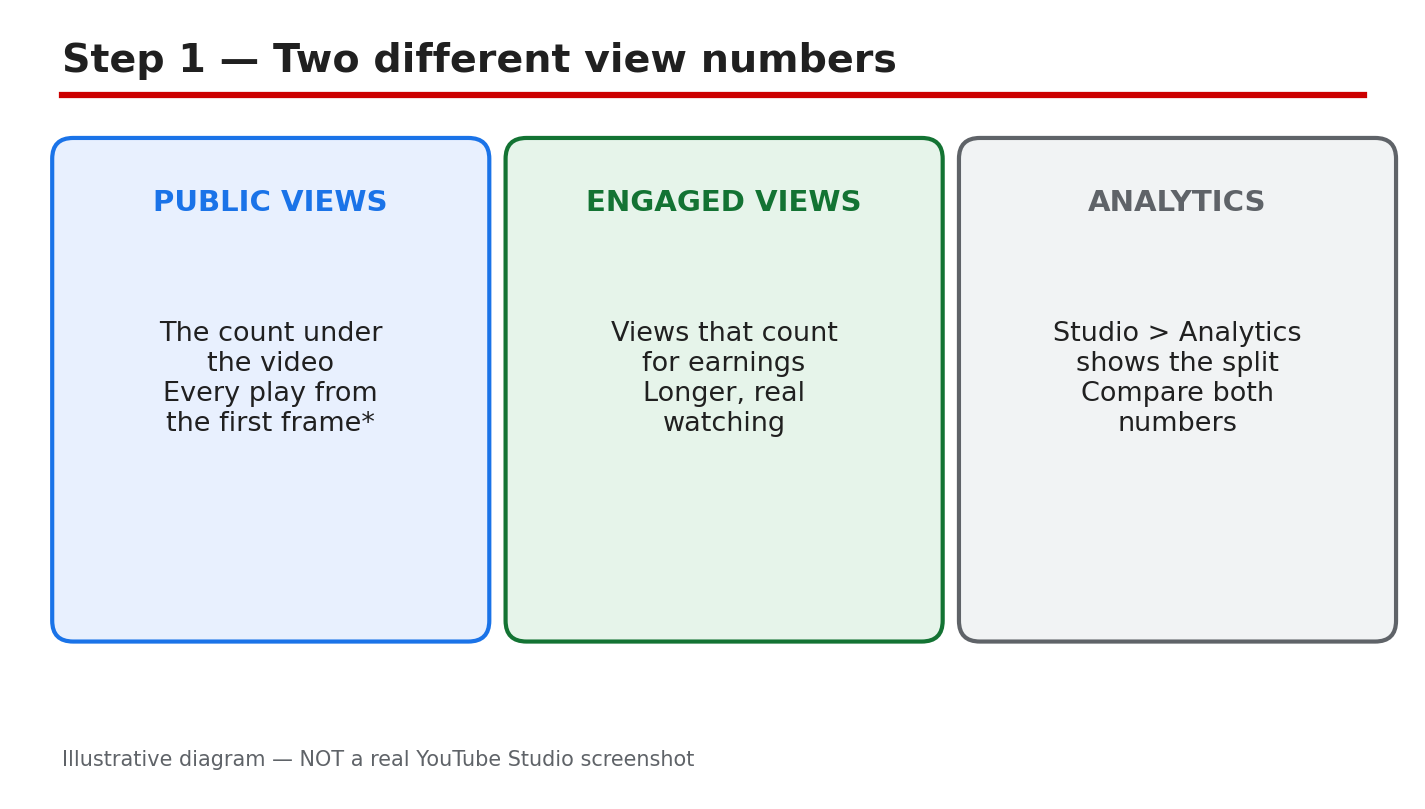
Diagram: public views, the count under a video, compared with engaged views, the count used for earnings. This is an illustrative diagram and mock-up, not a real YouTube Studio screenshot.
Step 1: Learn the Two View Numbers
Public views are the count shown under a video, on its watch page and in search results. Engaged views are the views that count for earnings, after YouTube applies its checks. A play can add to the public count without adding to the engaged count, for example when it is very short or when it is filtered out as invalid. That is why a video can look popular and still earn little.
Example: a Short shows 10,000 public views, but only 6,000 engaged views. The gap does not mean views were deleted; it means the two counts measure different things.
Common mistake: judging a video only by the public count. A high public count with low engagement can look like success while earnings stay low.
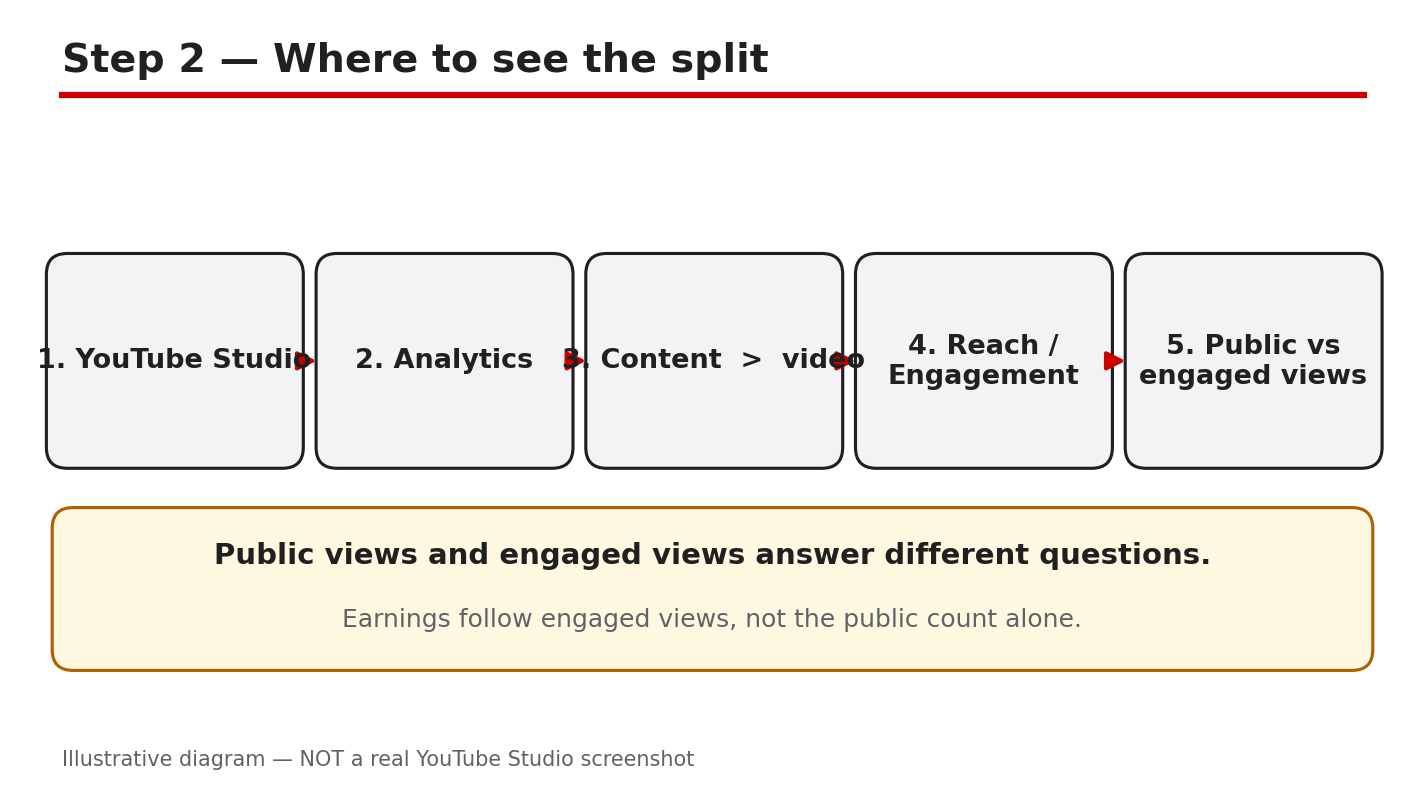
Diagram: the Studio path to the view split, from Analytics to a single video. This is an illustrative diagram and mock-up, not a real YouTube Studio screenshot.
Step 2: Find the Split in YouTube Studio
Open YouTube Studio and go to Analytics in the left menu. Open the Content tab, then open a single video. Look at the Reach tab for how viewers found the video, and the Engagement tab for how long they stayed. Compare the public view count on the video page with the figures shown in Analytics, and note the date range at the top, because different ranges give different totals.
Exact path: YouTube Studio > Analytics > Content > video > Reach / Engagement.
Example: for one Short, Reach shows most viewers came from the Shorts feed, while Engagement shows many swiped away quickly. The two tabs together explain why public views are high and watch time is low.
Common mistake: comparing a 28-day Analytics total with a lifetime public count. Always set the same date range before you compare two numbers.
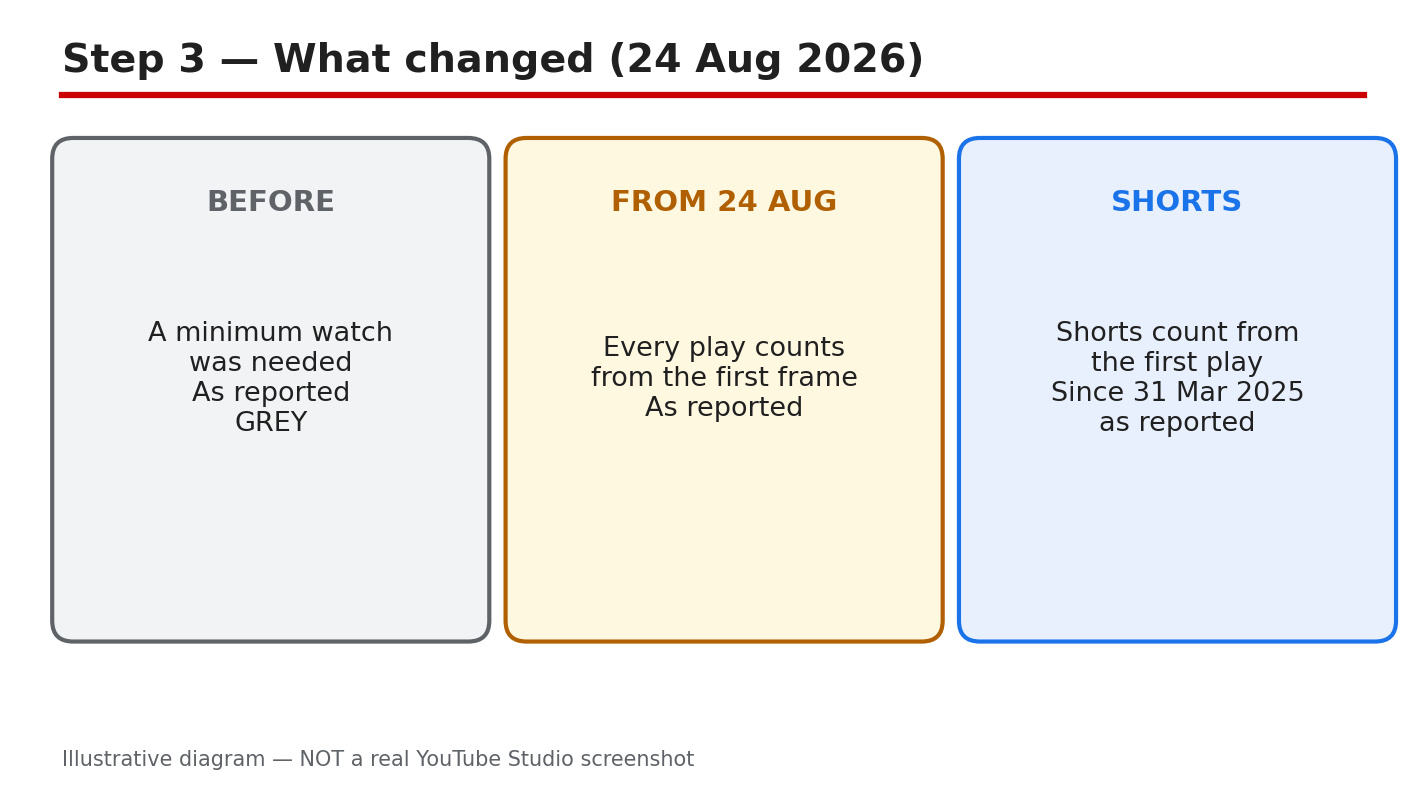
Diagram: the reported change, with views counted from the first frame. This is an illustrative diagram and mock-up, not a real YouTube Studio screenshot.
Step 3: Understand the Reported Counting Change
As reported, YouTube changed how views are counted. From 24 August 2026, a view is counted the moment a video starts to play, across all formats. For Shorts, the same first-frame approach was reported from 31 March 2025. Treat both dates as reported: this guide does not invent a threshold, such as a number of seconds, and you should check the official Help page for the current definition before you quote it.
The reported change affects the public count. As reported, it does not change how earnings are worked out, and it does not change Partner Program eligibility. That is the point most summaries miss: a higher public count does not by itself mean higher earnings.
Example: after the reported change, a long video shows more public views in its first week, but its earnings stay in line with engaged views. You would misread the video if you only watched the public count rise.
Common mistake: quoting a seconds threshold you read in a comment or a blog post. No threshold is stated in this guide, because none was verified here. Check the official page instead.
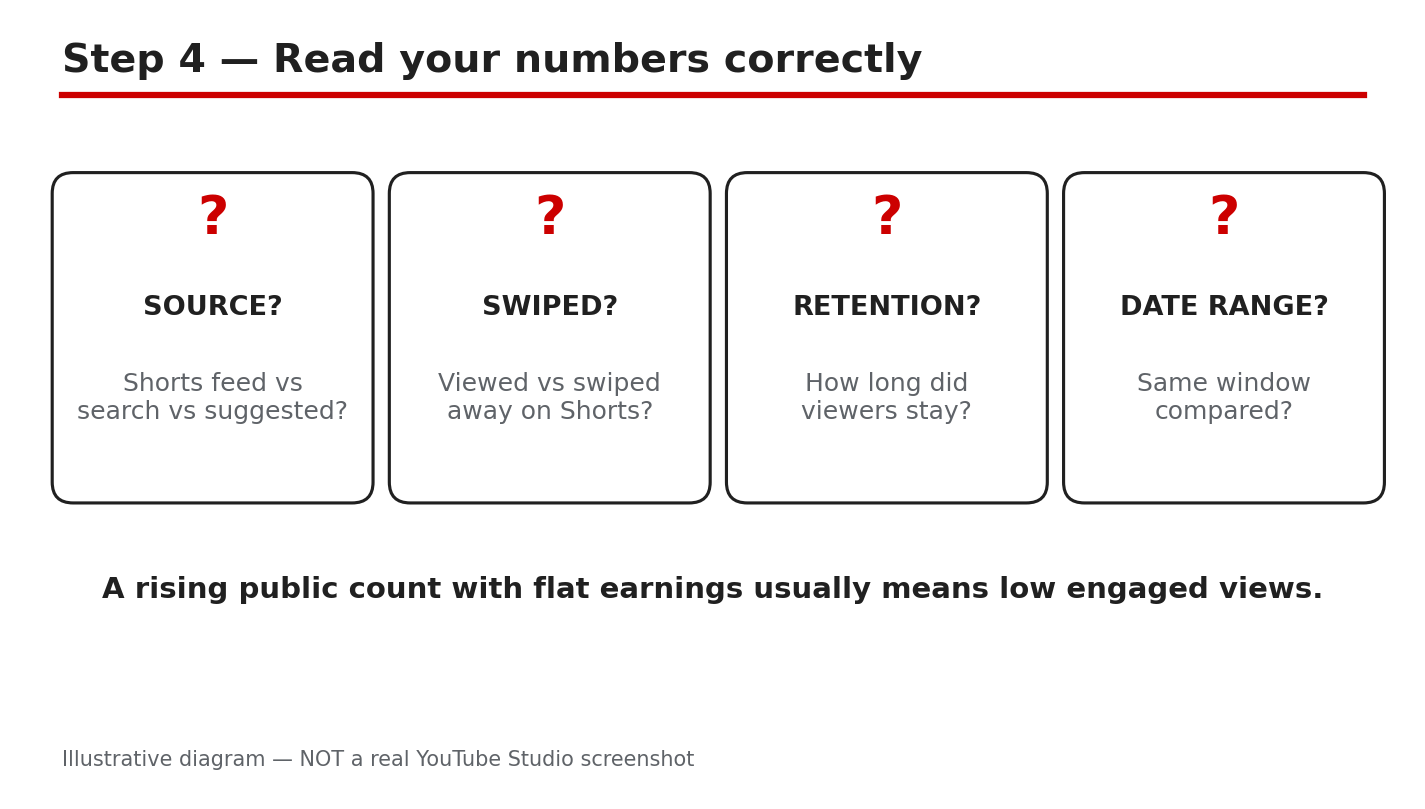
Diagram: reading numbers correctly, with traffic source, viewed versus swiped away, and retention. This is an illustrative diagram and mock-up, not a real YouTube Studio screenshot.
Step 4: Read the Numbers Correctly
Read four things together, not one number alone. First, traffic source: where did viewers come from, and did that source bring engaged viewers? Second, viewed versus swiped away: for Shorts, how many viewers stayed and how many swiped past? Third, retention: how long did viewers stay, on average, and where did they leave? Fourth, date range: are all the numbers from the same period?
Example: two Shorts each show 5,000 public views. One keeps viewers for most of its length; the other loses most viewers in the first second. The first Short is the stronger video, even though the public counts match.
Common mistake: comparing retention across videos of very different lengths. A 15-second Short and a 10-minute video will not hold viewers in the same way, so compare like with like.
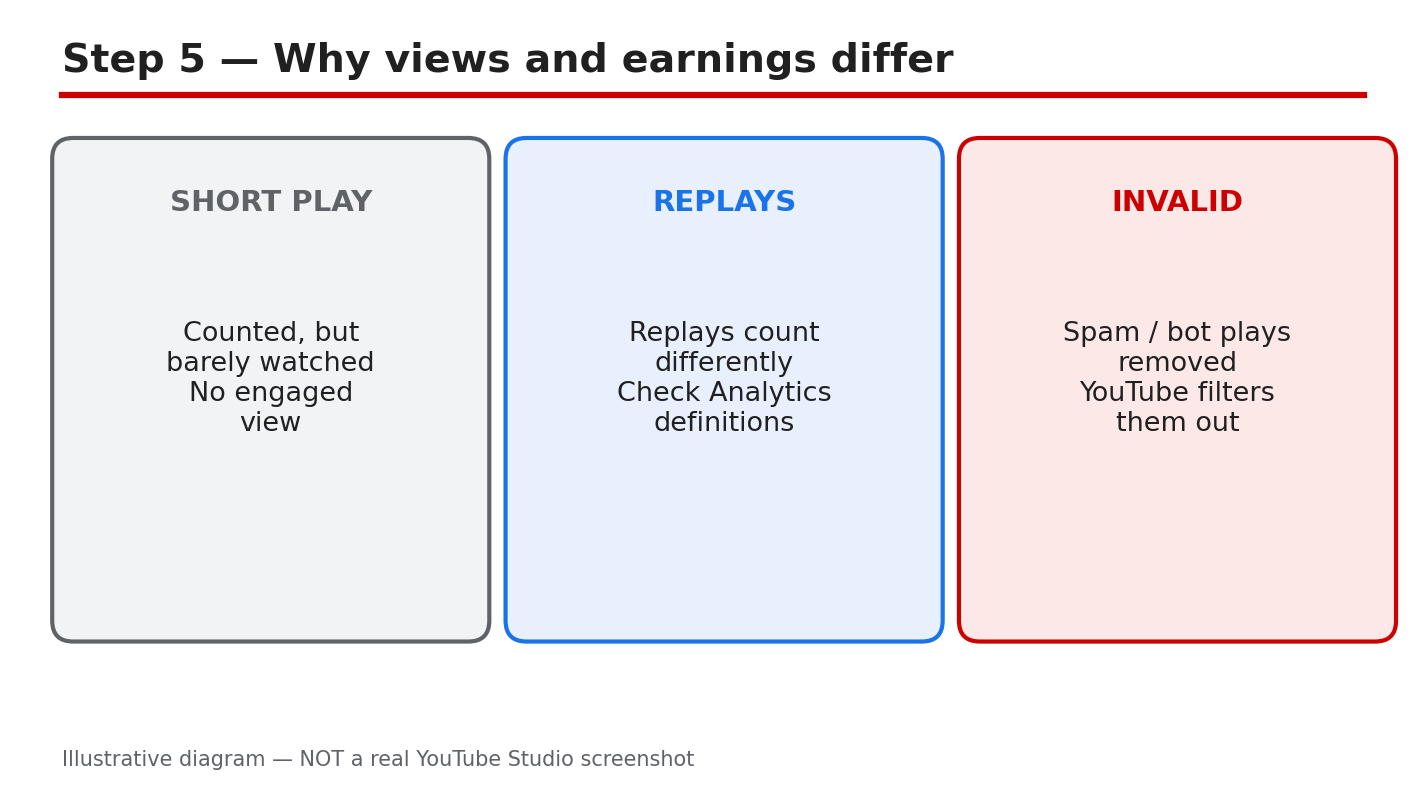
Diagram: why views and earnings differ, including short plays, replays, and filtered plays. This is an illustrative diagram and mock-up, not a real YouTube Studio screenshot.
Step 5: Why Views and Earnings Differ
Earnings follow engaged views, not every public view. Very short plays may count publicly but add little or nothing for earnings. Replays can add to the public count in ways that do not match earnings. Invalid or spam plays are filtered out, so they do not count for earnings even if a public total moved first. None of this means views were stolen; it means the two counts were never the same measure.
Example: a video gets shared in a group chat and many people open it for a second and leave. Public views rise, but engaged views and earnings barely move, because those plays were too short to count as engaged.
Common mistake: assuming every public view should pay the same. Earnings depend on engaged views, ad demand, and other factors, so the same view count can pay differently on different videos.
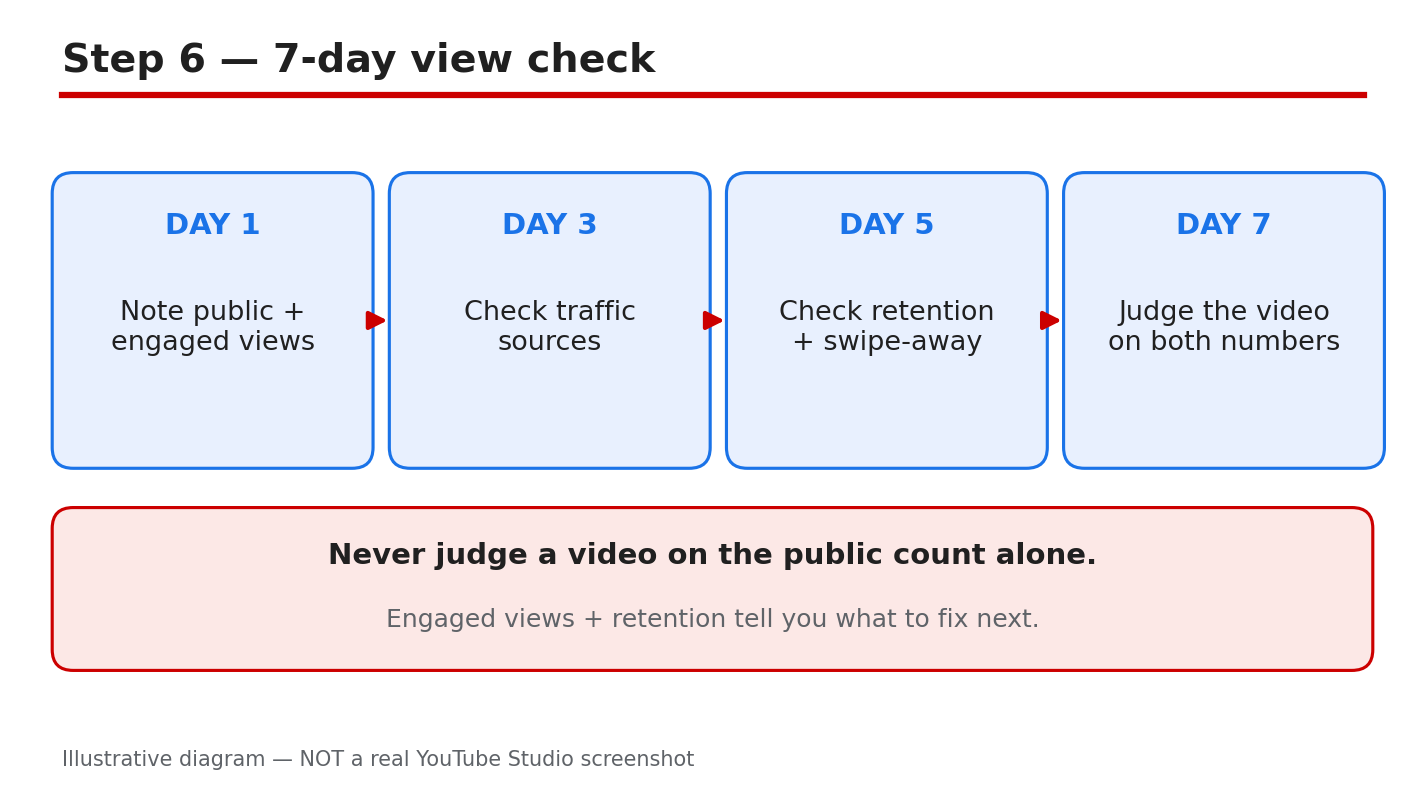
Diagram: the 7-day view check, run once a week on the same day. This is an illustrative diagram and mock-up, not a real YouTube Studio screenshot.
Step 6: Run a 7-Day View Check
Once a week, on the same day, open Analytics and set the date range to the last 7 days. Write down four numbers for your newest video: public views, the Reach figure, the Engagement figure, and the traffic source that brought the most viewers. Compare them with the previous week, using the same date range and the same video. A single week will not tell you everything, but a repeated check shows whether a change is a trend or a one-off.
Example: every Monday, you check last week’s Short. Public views fell, but viewed-versus-swiped-away improved. The video is not failing; fewer people found it, but more of those who did stayed.
Common mistake: changing the date range each week and then comparing the totals. Keep the range, the video, and the day the same, or the comparison means nothing.
Quick Checklist
- Public views and engaged views kept separate.
- Studio split checked: Analytics > Content > video.
- Same date range used for every comparison.
- Traffic source, viewed versus swiped away, and retention read together.
- No seconds threshold quoted without an official source.
- Reported dates treated as reported, and checked officially.
- Short plays, replays, and filtered plays allowed for in the gap.
- 7-day check written down, same day each week.
Frequently Asked Questions
What is the difference between public views and engaged views?
Public views are the count shown under a video. Engaged views are the views that count for earnings, after YouTube’s checks. A play can add to one count without adding to the other.
Did YouTube change how views are counted in 2026?
As reported, from 24 August 2026 a view is counted the moment a video starts to play, across all formats, and Shorts were reported to use the same approach from 31 March 2025. Check the official Help page for the current definition, because this guide reports the change and does not set a threshold.
Why do my views rise but my earnings stay flat?
Earnings follow engaged views, not public views. Short plays, replays, and filtered plays can move the public count without moving earnings. Read the Studio split before you judge a video.
How often should I check my view numbers?
Once a week is enough for most creators. Use the 7-day check in Step 6, keep the date range and the day the same, and look for a trend over several weeks rather than reacting to one day.
Sources — Check It Yourself
Check the official pages below for the current definition, and re-check them before you quote a date or a rule. No official YouTube video was embedded in this post: no exact official video was verified live in this run, so none is shown here.