YouTube Analytics Traffic Sources — Where Your Views Actually Come From
 CreatorPlaybook Team
- 14 Nov, 2026
Intro
Your view count tells you how many people watched — never how they found you, and that decides what to fix next. The traffic-source report splits every view into the place it came from: Browse features, Suggested videos, YouTube search, the Shorts feed, External sites, Playlists, Channel pages, and more. Read it as a diagnosis, not a definition list: strong Search with near-zero Browse differs from a video riding Suggested. This guide shows where the report lives, what each source means, and what to change when a source is missing or dominant. Views vs unique viewers is a separate post.
What You Will Learn
- Where the report lives, at channel level and per video
- What Browse, Suggested and Search mean — and what each diagnoses
- What the smaller sources tell you: Shorts, External, Playlists, Channel pages, Notifications
- How to compare two videos or two periods to find what changed
- What to fix when a source is missing or dominates
- The checks that stop you blaming a working report
Step 1 — Open the right report: channel first, then one video
What to do: Open the report twice: once for the whole channel, once for a single video.
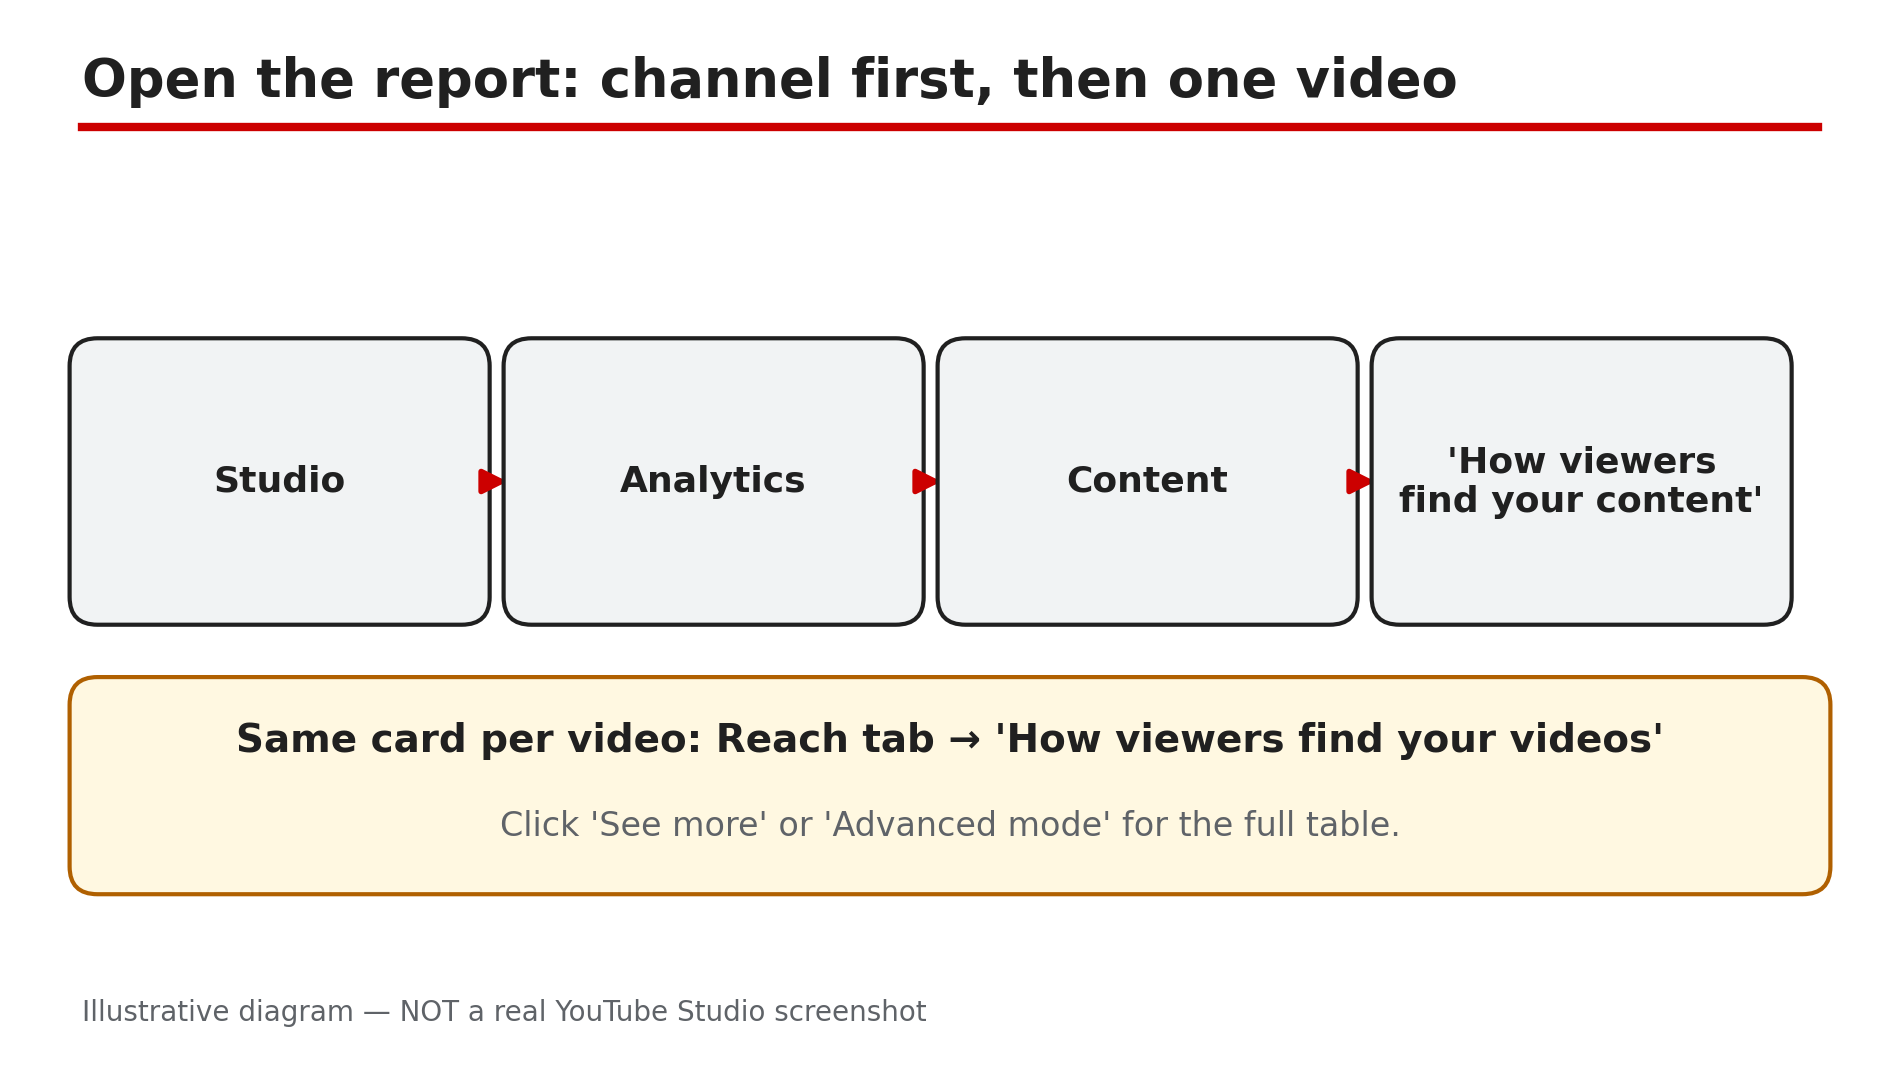
How: In YouTube Studio, open Analytics, then Content. The Help page opened live for this post says the Content tab “gives you an overview of how your audience finds your content” — channel level only. Scroll to “How viewers find your content”. For one video, use the Reach tab card “How viewers find your videos”. Click “See more” or “Advanced mode” for the full table.
Example: A creator sees Browse at 45% channel-wide, but her newest video shows 4% — the average hid a video the home feed never picked up.
Common mistake: Judging a video from the channel report alone — the channel mix is an average, and one video’s problem disappears inside it.
Illustrative diagram: the path to the traffic-source report in YouTube Studio, channel level first, then one video.
Step 2 — Read the big three: Browse, Suggested and Search
What to do: Read Browse, Suggested and Search first — for most channels these three carry the bulk of views, and each points at a different fix.
How: YouTube’s Help page defines them plainly, as read live on 14 November 2026. Browse features is “traffic from the Home, subscriptions, Watch Later, Trending/Explore and other browsing features” — YouTube itself choosing to show your video. Suggested videos is “traffic from suggestions that appear next to or after other videos” — viewers arriving from another video’s audience. YouTube search is “traffic from YouTube search results”; the exact search terms sit on the “Traffic source: YouTube Search” card.
Example: Two videos, 10,000 views each: one got 7,000 from Search, the other 7,000 from Browse.
Common mistake: Treating all views as equal — a Search-heavy video and a Browse-heavy video need opposite fixes.
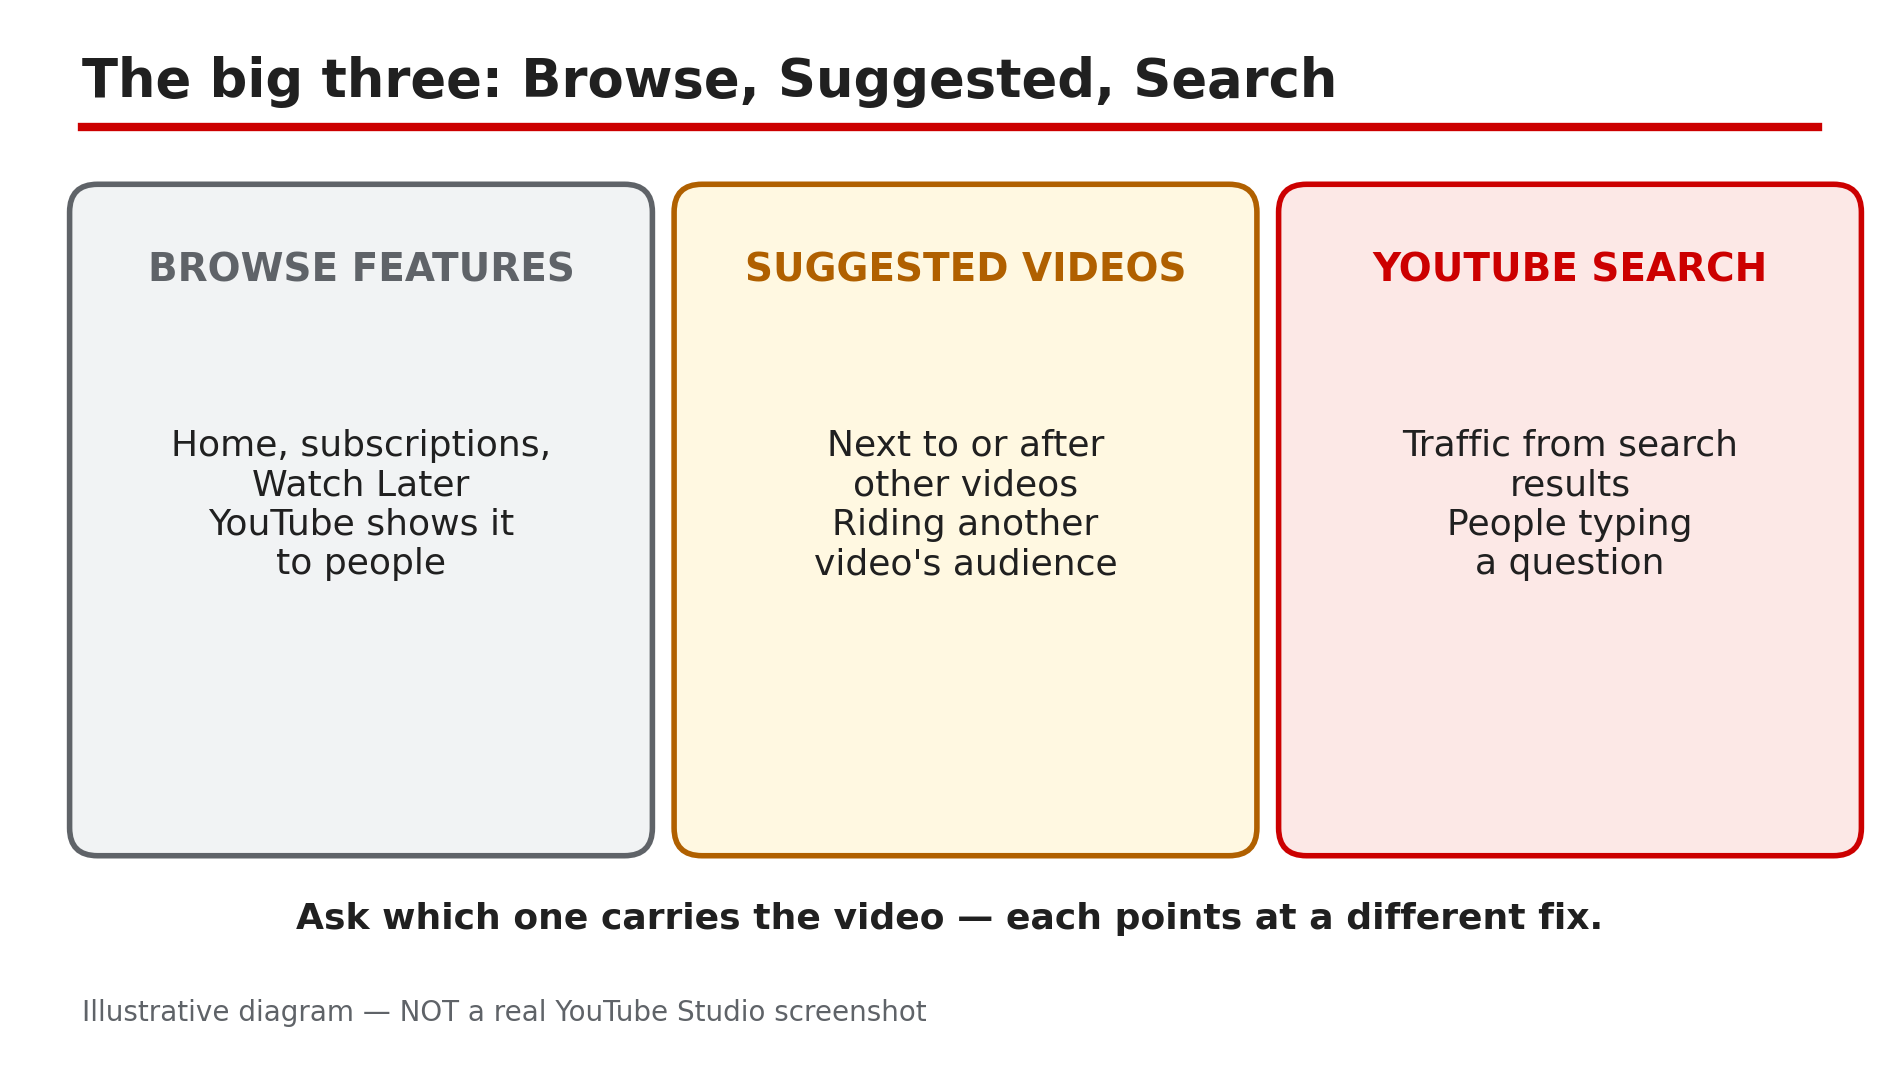
Illustrative diagram: the big three traffic sources — Browse features, Suggested videos and YouTube search — and what each one means.
Step 3 — Read the smaller sources
What to do: Scroll past the big three — a small source that suddenly grows is often the most useful line.
How: The Help page lists them all. Shorts is “traffic from the Shorts vertical viewing experience” — the swipe feed, which swings wildly. External is “traffic from websites and apps that have your YouTube video embedded or linked to” — the sites sit on the “Traffic source: External” card. Playlists is “traffic from any playlist that included one of your videos” — yours, another creator’s, or a viewer’s Liked videos. Channel pages is traffic from channel pages, Notifications from subscriber notifications, Direct or unknown is “traffic from direct URL entry, bookmarks, signed out viewers, and unidentified apps”. A source at 2% is background noise; at 20% it is a story.
Example: A tutorial jumps from 200 to 3,000 views a day, and External is suddenly 60%. One blog embedded the video — one embed, not a channel-wide breakthrough.
Common mistake: Ignoring the small rows. The cause of a spike or slump is usually sitting in a row you never scrolled to.
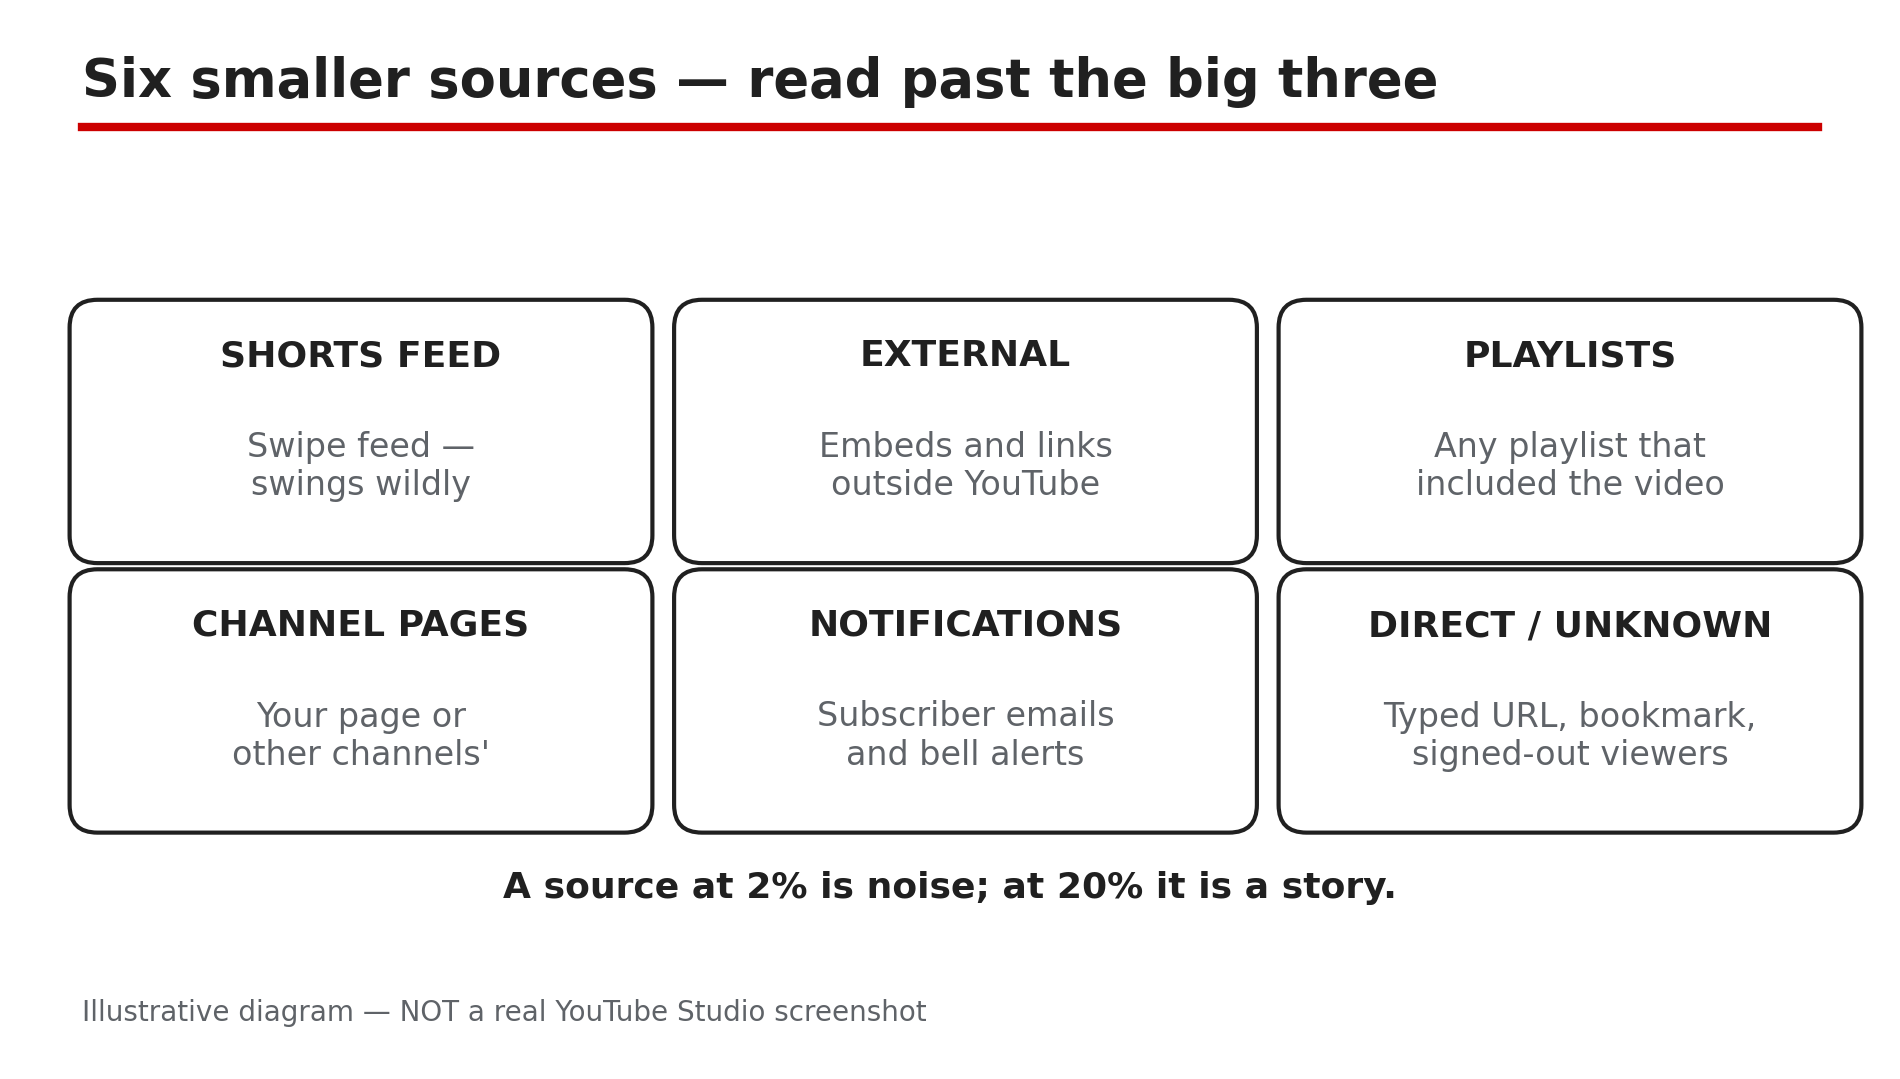
Illustrative diagram: six smaller traffic sources — Shorts feed, External, Playlists, Channel pages, Notifications and Direct or unknown.
Step 4 — Compare two videos or two periods
What to do: Never read one report in isolation — compare the video with another video, or with its own earlier period, in Advanced mode.
How: In Advanced mode, compare with a second video, or the same video over a previous 28 days. Look for the source that moved, not the total. If views fell but Search stayed flat while Browse dropped by half, the video stopped being pushed on the home feed while searchers kept finding it. Pair this with the retention graph: strong Suggested traffic with viewers leaving in the first 30 seconds will stop being suggested, as our retention-graph guide explains. Traffic tells you where viewers came from; retention tells you whether they stayed.
Example: Two videos with 8,000 views each: one is 70% Suggested, the other 70% Search. The first depends on other videos’ audiences; the second on a question people keep typing.
Common mistake: Comparing view totals instead of source mixes — two videos with identical totals can have opposite problems.
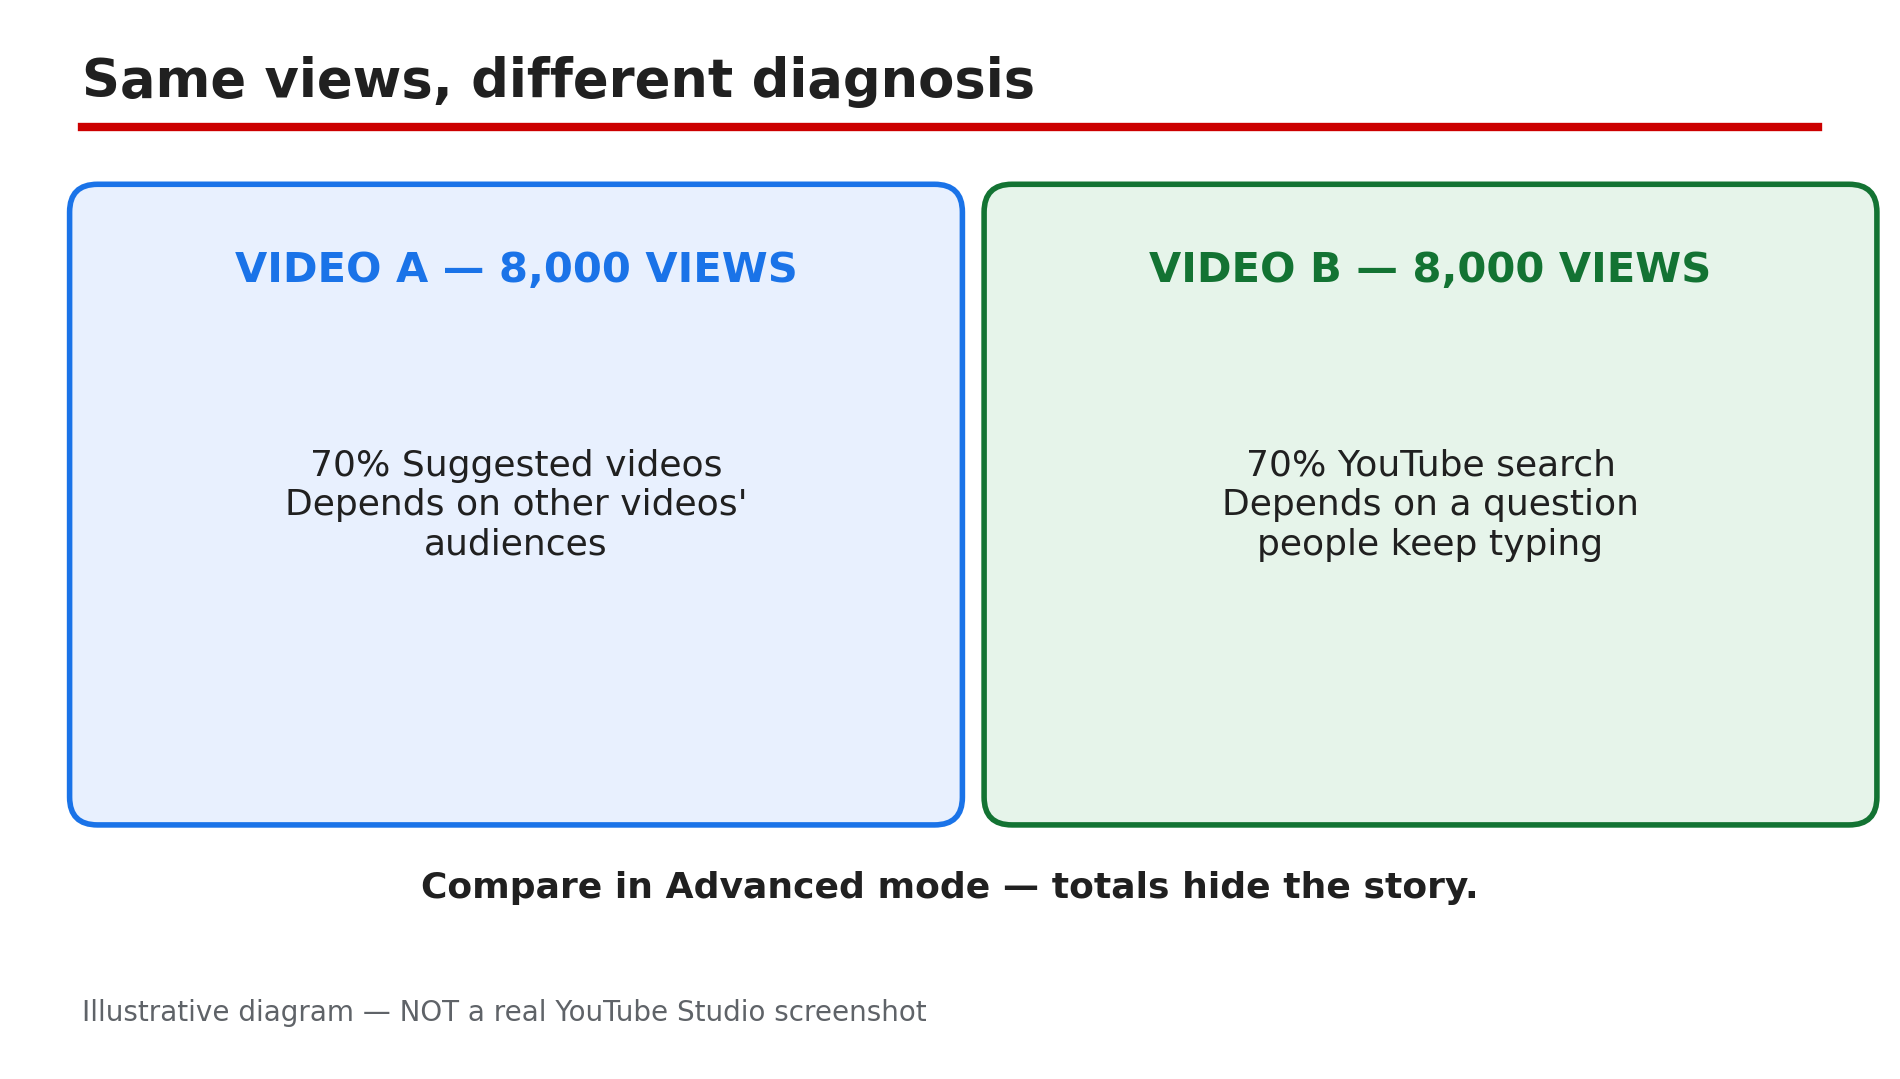
Illustrative diagram: two videos with the same views but different traffic sources — one 70% Suggested, one 70% Search.
Step 5 — Fix the missing or dominant source
What to do: Turn the diagnosis into one fix per source — change what that source depends on.
How: Browse near zero with strong Search: the thumbnail and title are not winning the home feed — test a clearer thumbnail and a sharper title. Strong Suggested: the video rides other videos’ audiences — make the next video on a closely related topic. Weak Search: the title and description do not match the words people type — check the exact terms on the “Traffic source: YouTube Search” card. External spike? Open the External card and find the one site or share behind it — a single embed can vanish as fast as it appeared. If the Shorts feed dominates a Short, judge by the pattern across several uploads, not one video.
Example: A channel’s how-to videos get 60% of views from Search. The creator titles the next five videos around the exact questions in her Search terms report — and Search grows further.
Common mistake: Fixing the wrong source. Rewriting titles will not help a Browse problem, and a new thumbnail will not help a video nobody searches for.
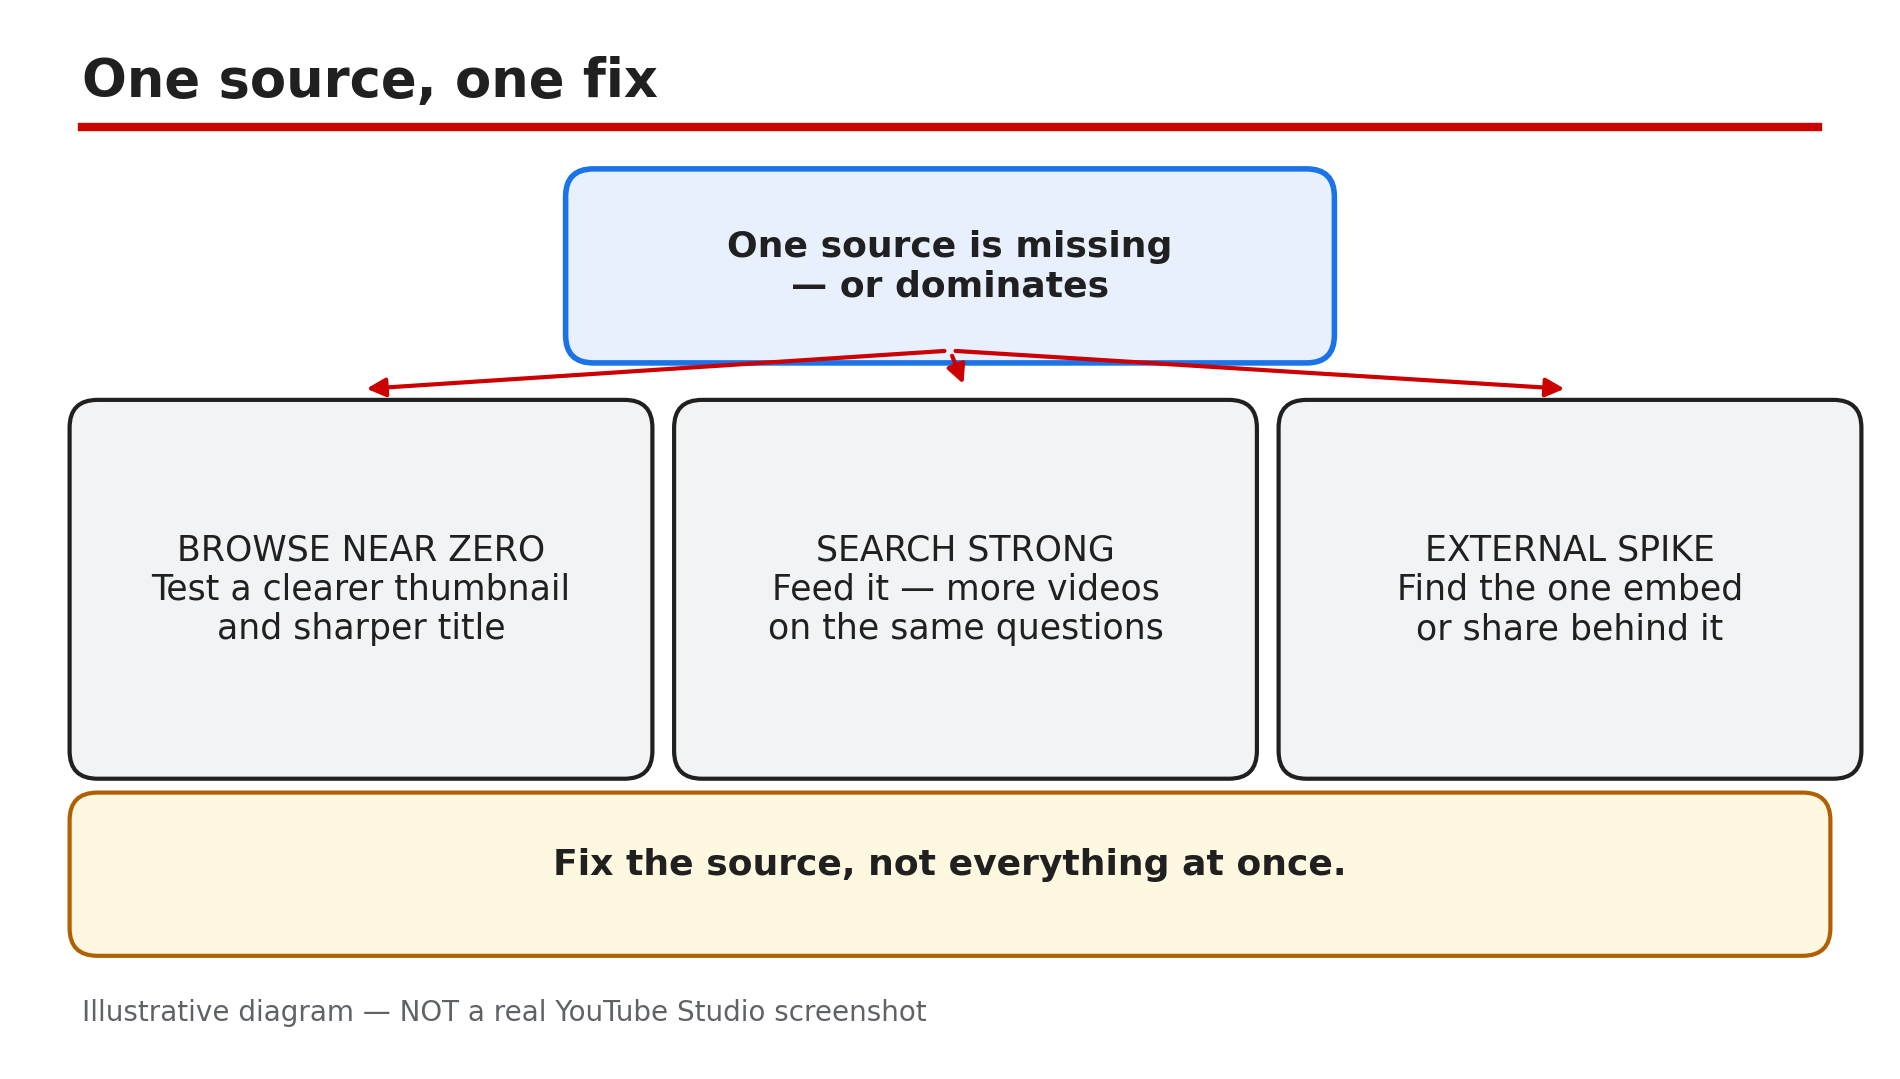
Illustrative diagram: one source, one fix — Browse near zero, Search strong, or an External spike.
Step 6 — Rule out the false alarm first
What to do: If a traffic source is missing or the report looks empty, check the video itself before concluding Analytics is broken.
How: First, check visibility in Studio: a private or unlisted video is not publicly discoverable, so as reported it collects no Browse, Suggested or Search traffic — viewers arrive only via the direct link. YouTube’s limited-data Help page, checked during research, says private or unlisted videos show no demographics or geography data, and one-off search terms may not appear on the traffic-source report. Second, confirm the video has finished processing and has no age restriction — as reported, either limits where it is shown. Third, Analytics data can be delayed: wait and re-check — see our post on Analytics missing or delayed for the full checks. Only then treat a missing source as a real problem.
Example: A creator panics over zero Suggested traffic — then finds the video is still unlisted, shared with a friend for a preview. Once Public, Browse and Suggested appear over the next day.
Common mistake: Re-uploading over an empty report — a private, unlisted, restricted or still-processing video explains it more often than any Analytics fault.
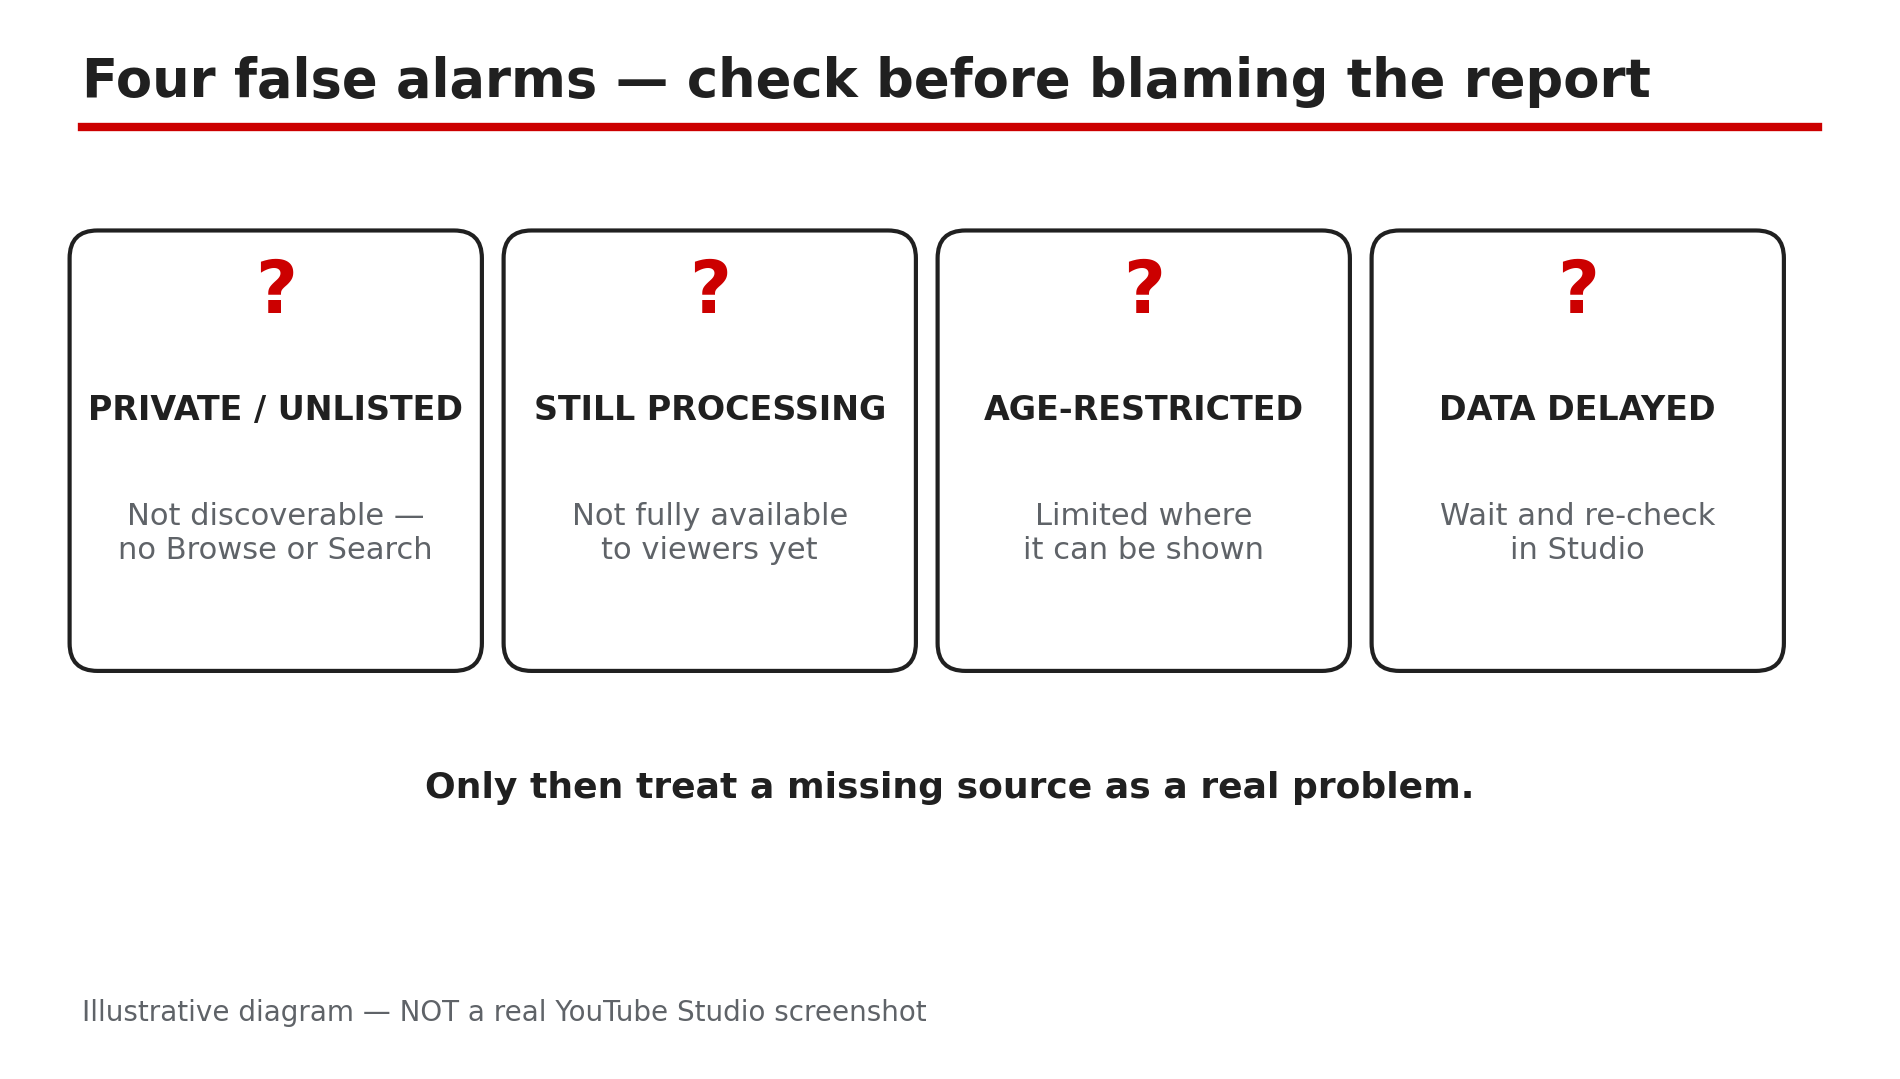
Illustrative diagram: four false alarms to check before blaming the report — private or unlisted, still processing, age-restricted, delayed data.
Checklist — Read traffic sources like a diagnosis
- ☐ Channel report: Studio → Analytics → Content → “How viewers find your content”
- ☐ Same report for one video: Reach tab → “How viewers find your videos”
- ☐ Read Browse, Suggested, Search; noted which carries the video
- ☐ Checked the smaller sources — Shorts, External, Playlists, Channel pages, Notifications, Direct/unknown
- ☐ Compared with another video or earlier period in Advanced mode
- ☐ Fix matched to the source: Browse → thumbnail/title, Search → terms, Suggested → related topics, External → one embed
- ☐ Checked visibility, processing, restrictions before blaming the report
- ☐ Paired traffic source with retention graph before concluding
FAQs
1. Where do I find traffic sources in YouTube Analytics?
In YouTube Studio, open Analytics, then Content, and look for “How viewers find your content”. For one video, use the Reach tab card “How viewers find your videos”.
2. What is the difference between Browse features and Suggested videos?
Browse features is traffic from the Home page, subscriptions, Watch Later and other browsing features. Suggested videos is traffic from suggestions next to or after other videos — both definitions from the Help page opened live for this post.
3. Why is my Browse traffic near zero when Search is strong?
As reported, it usually means the video is findable but not winning the home feed: searchers click it, Home scrollers pass it by. Test a clearer thumbnail and a more specific title.
4. Why did my External traffic suddenly spike?
Open the “Traffic source: External” card — as reported, a spike usually traces to one site that embedded or linked the video. Find it before treating the spike as growth.
5. Why is a traffic source missing from my video’s report?
Check the video first: as reported, a private or unlisted video gets no Browse, Suggested or Search traffic, and a video still processing or age-restricted may show limited data. Analytics can also be delayed.
Sources
- YouTube Help — “Understand your YouTube content performance” (official Help page, opened live 14 Nov 2026): https://support.google.com/youtube/answer/12220281?hl=en
- CreatorPlaybook — “Views vs Unique Viewers vs Impressions on YouTube — What Each Number Really Means” (internal link): </blog/views-vs-unique-viewers-vs-impressions>
- CreatorPlaybook — “YouTube Studio Analytics Missing or Delayed? What to Check First” (internal link): </blog/youtube-studio-analytics-missing-or>