Showing Posts From
Youtube analytics
 CreatorPlaybook Team
- 14 Nov, 2026
YouTube Analytics Traffic Sources — Where Your Views Actually Come From
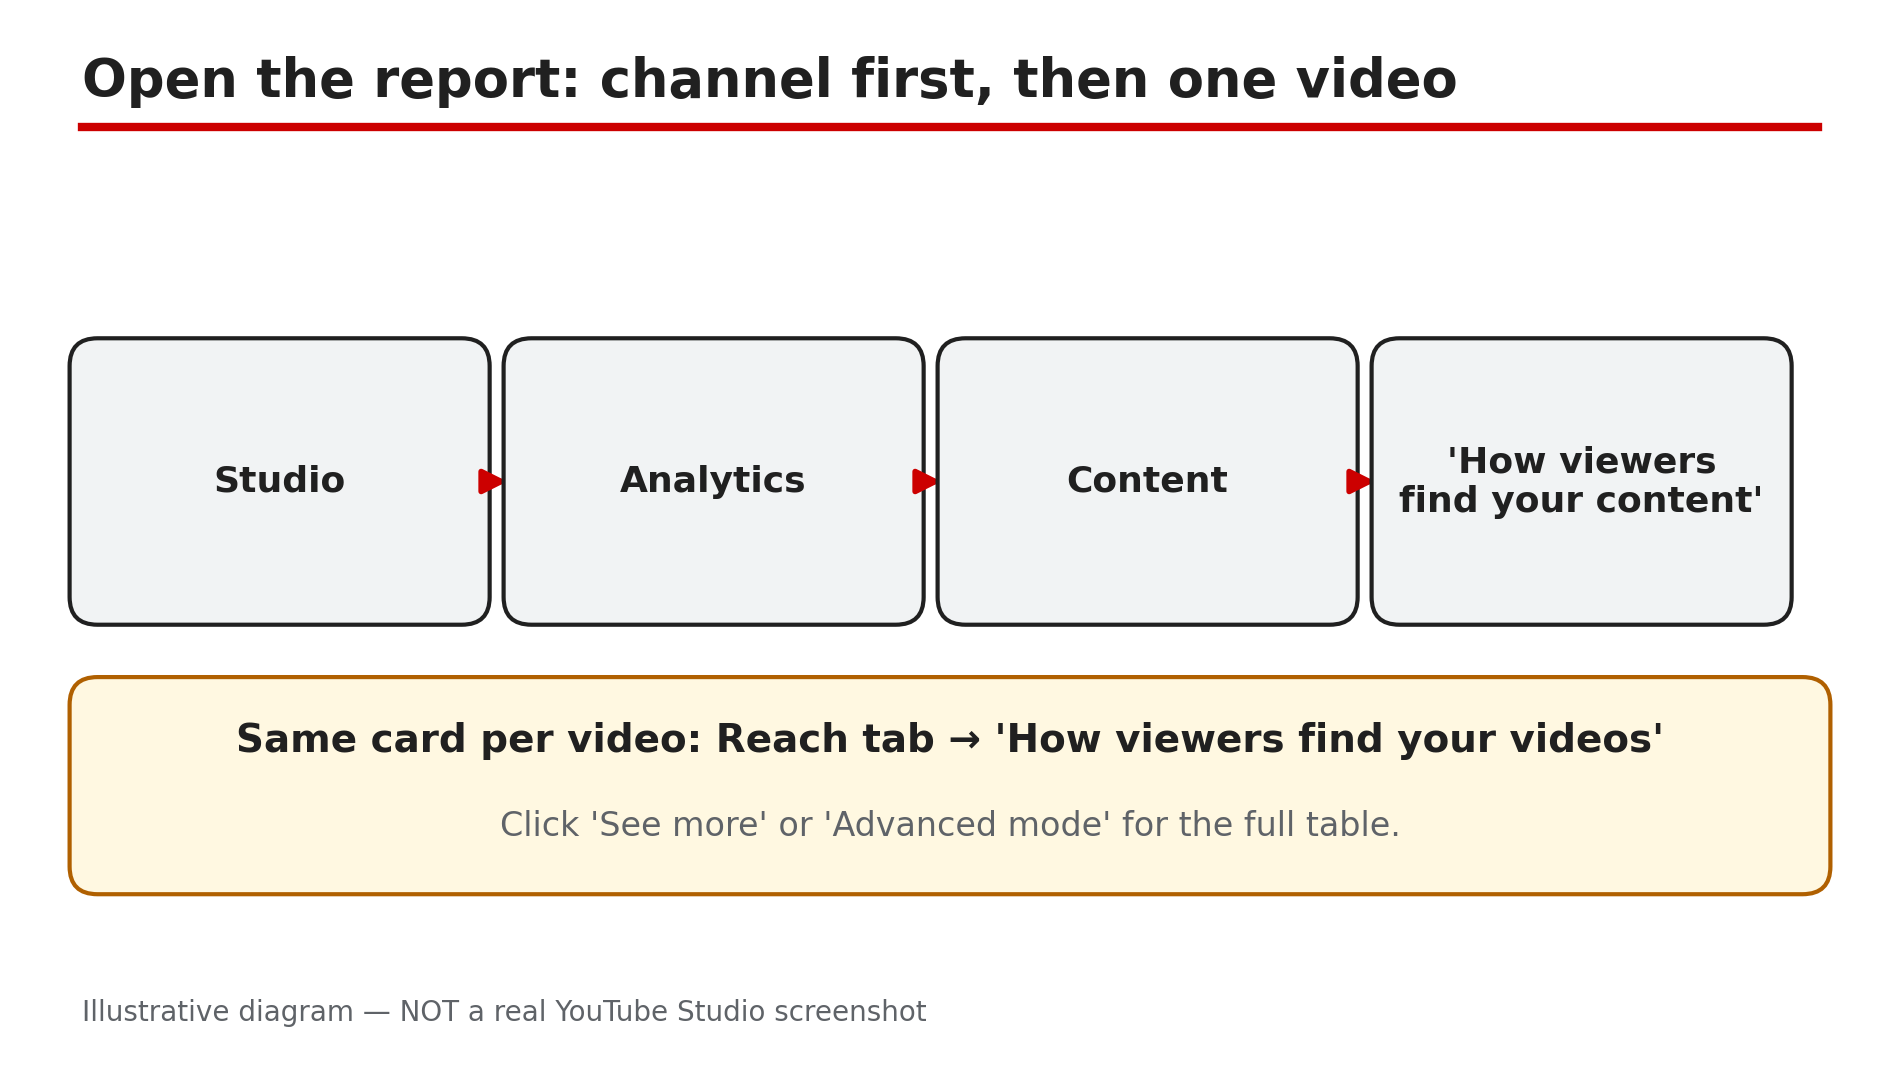
Intro Your view count tells you how many people watched — never how they found you, and that decides what to fix next. The traffic-source report splits every view into the place it came from: Browse features, Suggested videos, YouTube search, the Shorts feed, External sites, Playlists, Channel pages, and more. Read it as a diagnosis, not a definition list: strong Search with near-zero Browse differs from a video riding Suggested. This guide shows where the report lives, what each source means, and what to change when a source is missing or dominant. Views vs unique viewers is a separate post. What You Will LearnWhere the report lives, at channel level and per video What Browse, Suggested and Search mean — and what each diagnoses What the smaller sources tell you: Shorts, External, Playlists, Channel pages, Notifications How to compare two videos or two periods to find what changed What to fix when a source is missing or dominates The checks that stop you blaming a working reportStep 1 — Open the right report: channel first, then one video What to do: Open the report twice: once for the whole channel, once for a single video. How: In YouTube Studio, open Analytics, then Content. The Help page opened live for this post says the Content tab "gives you an overview of how your audience finds your content" — channel level only. Scroll to "How viewers find your content". For one video, use the Reach tab card "How viewers find your videos". Click "See more" or "Advanced mode" for the full table. Example: A creator sees Browse at 45% channel-wide, but her newest video shows 4% — the average hid a video the home feed never picked up. Common mistake: Judging a video from the channel report alone — the channel mix is an average, and one video's problem disappears inside it.Illustrative diagram: the path to the traffic-source report in YouTube Studio, channel level first, then one video. Step 2 — Read the big three: Browse, Suggested and Search What to do: Read Browse, Suggested and Search first — for most channels these three carry the bulk of views, and each points at a different fix. How: YouTube's Help page defines them plainly, as read live on 14 November 2026. Browse features is "traffic from the Home, subscriptions, Watch Later, Trending/Explore and other browsing features" — YouTube itself choosing to show your video. Suggested videos is "traffic from suggestions that appear next to or after other videos" — viewers arriving from another video's audience. YouTube search is "traffic from YouTube search results"; the exact search terms sit on the "Traffic source: YouTube Search" card. Example: Two videos, 10,000 views each: one got 7,000 from Search, the other 7,000 from Browse. Common mistake: Treating all views as equal — a Search-heavy video and a Browse-heavy video need opposite fixes.Illustrative diagram: the big three traffic sources — Browse features, Suggested videos and YouTube search — and what each one means. Step 3 — Read the smaller sources What to do: Scroll past the big three — a small source that suddenly grows is often the most useful line. How: The Help page lists them all. Shorts is "traffic from the Shorts vertical viewing experience" — the swipe feed, which swings wildly. External is "traffic from websites and apps that have your YouTube video embedded or linked to" — the sites sit on the "Traffic source: External" card. Playlists is "traffic from any playlist that included one of your videos" — yours, another creator's, or a viewer's Liked videos. Channel pages is traffic from channel pages, Notifications from subscriber notifications, Direct or unknown is "traffic from direct URL entry, bookmarks, signed out viewers, and unidentified apps". A source at 2% is background noise; at 20% it is a story. Example: A tutorial jumps from 200 to 3,000 views a day, and External is suddenly 60%. One blog embedded the video — one embed, not a channel-wide breakthrough. Common mistake: Ignoring the small rows. The cause of a spike or slump is usually sitting in a row you never scrolled to.Illustrative diagram: six smaller traffic sources — Shorts feed, External, Playlists, Channel pages, Notifications and Direct or unknown. Step 4 — Compare two videos or two periods What to do: Never read one report in isolation — compare the video with another video, or with its own earlier period, in Advanced mode. How: In Advanced mode, compare with a second video, or the same video over a previous 28 days. Look for the source that moved, not the total. If views fell but Search stayed flat while Browse dropped by half, the video stopped being pushed on the home feed while searchers kept finding it. Pair this with the retention graph: strong Suggested traffic with viewers leaving in the first 30 seconds will stop being suggested, as our retention-graph guide explains. Traffic tells you where viewers came from; retention tells you whether they stayed. Example: Two videos with 8,000 views each: one is 70% Suggested, the other 70% Search. The first depends on other videos' audiences; the second on a question people keep typing. Common mistake: Comparing view totals instead of source mixes — two videos with identical totals can have opposite problems.Illustrative diagram: two videos with the same views but different traffic sources — one 70% Suggested, one 70% Search. Step 5 — Fix the missing or dominant source What to do: Turn the diagnosis into one fix per source — change what that source depends on. How: Browse near zero with strong Search: the thumbnail and title are not winning the home feed — test a clearer thumbnail and a sharper title. Strong Suggested: the video rides other videos' audiences — make the next video on a closely related topic. Weak Search: the title and description do not match the words people type — check the exact terms on the "Traffic source: YouTube Search" card. External spike? Open the External card and find the one site or share behind it — a single embed can vanish as fast as it appeared. If the Shorts feed dominates a Short, judge by the pattern across several uploads, not one video. Example: A channel's how-to videos get 60% of views from Search. The creator titles the next five videos around the exact questions in her Search terms report — and Search grows further. Common mistake: Fixing the wrong source. Rewriting titles will not help a Browse problem, and a new thumbnail will not help a video nobody searches for.Illustrative diagram: one source, one fix — Browse near zero, Search strong, or an External spike. Step 6 — Rule out the false alarm first What to do: If a traffic source is missing or the report looks empty, check the video itself before concluding Analytics is broken. How: First, check visibility in Studio: a private or unlisted video is not publicly discoverable, so as reported it collects no Browse, Suggested or Search traffic — viewers arrive only via the direct link. YouTube's limited-data Help page, checked during research, says private or unlisted videos show no demographics or geography data, and one-off search terms may not appear on the traffic-source report. Second, confirm the video has finished processing and has no age restriction — as reported, either limits where it is shown. Third, Analytics data can be delayed: wait and re-check — see our post on Analytics missing or delayed for the full checks. Only then treat a missing source as a real problem. Example: A creator panics over zero Suggested traffic — then finds the video is still unlisted, shared with a friend for a preview. Once Public, Browse and Suggested appear over the next day. Common mistake: Re-uploading over an empty report — a private, unlisted, restricted or still-processing video explains it more often than any Analytics fault.Illustrative diagram: four false alarms to check before blaming the report — private or unlisted, still processing, age-restricted, delayed data. Checklist — Read traffic sources like a diagnosis☐ Channel report: Studio → Analytics → Content → "How viewers find your content" ☐ Same report for one video: Reach tab → "How viewers find your videos" ☐ Read Browse, Suggested, Search; noted which carries the video ☐ Checked the smaller sources — Shorts, External, Playlists, Channel pages, Notifications, Direct/unknown ☐ Compared with another video or earlier period in Advanced mode ☐ Fix matched to the source: Browse → thumbnail/title, Search → terms, Suggested → related topics, External → one embed ☐ Checked visibility, processing, restrictions before blaming the report ☐ Paired traffic source with retention graph before concludingFAQs 1. Where do I find traffic sources in YouTube Analytics? In YouTube Studio, open Analytics, then Content, and look for "How viewers find your content". For one video, use the Reach tab card "How viewers find your videos". 2. What is the difference between Browse features and Suggested videos? Browse features is traffic from the Home page, subscriptions, Watch Later and other browsing features. Suggested videos is traffic from suggestions next to or after other videos — both definitions from the Help page opened live for this post. 3. Why is my Browse traffic near zero when Search is strong? As reported, it usually means the video is findable but not winning the home feed: searchers click it, Home scrollers pass it by. Test a clearer thumbnail and a more specific title. 4. Why did my External traffic suddenly spike? Open the "Traffic source: External" card — as reported, a spike usually traces to one site that embedded or linked the video. Find it before treating the spike as growth. 5. Why is a traffic source missing from my video's report? Check the video first: as reported, a private or unlisted video gets no Browse, Suggested or Search traffic, and a video still processing or age-restricted may show limited data. Analytics can also be delayed. SourcesYouTube Help — "Understand your YouTube content performance" (official Help page, opened live 14 Nov 2026): https://support.google.com/youtube/answer/12220281?hl=en CreatorPlaybook — "Views vs Unique Viewers vs Impressions on YouTube — What Each Number Really Means" (internal link): </blog/views-vs-unique-viewers-vs-impressions> CreatorPlaybook — "YouTube Studio Analytics Missing or Delayed? What to Check First" (internal link): </blog/youtube-studio-analytics-missing-or>
- CreatorPlaybook Team
- 12 Nov, 2026
Views vs Unique Viewers vs Impressions on YouTube: What Each Number Really Means
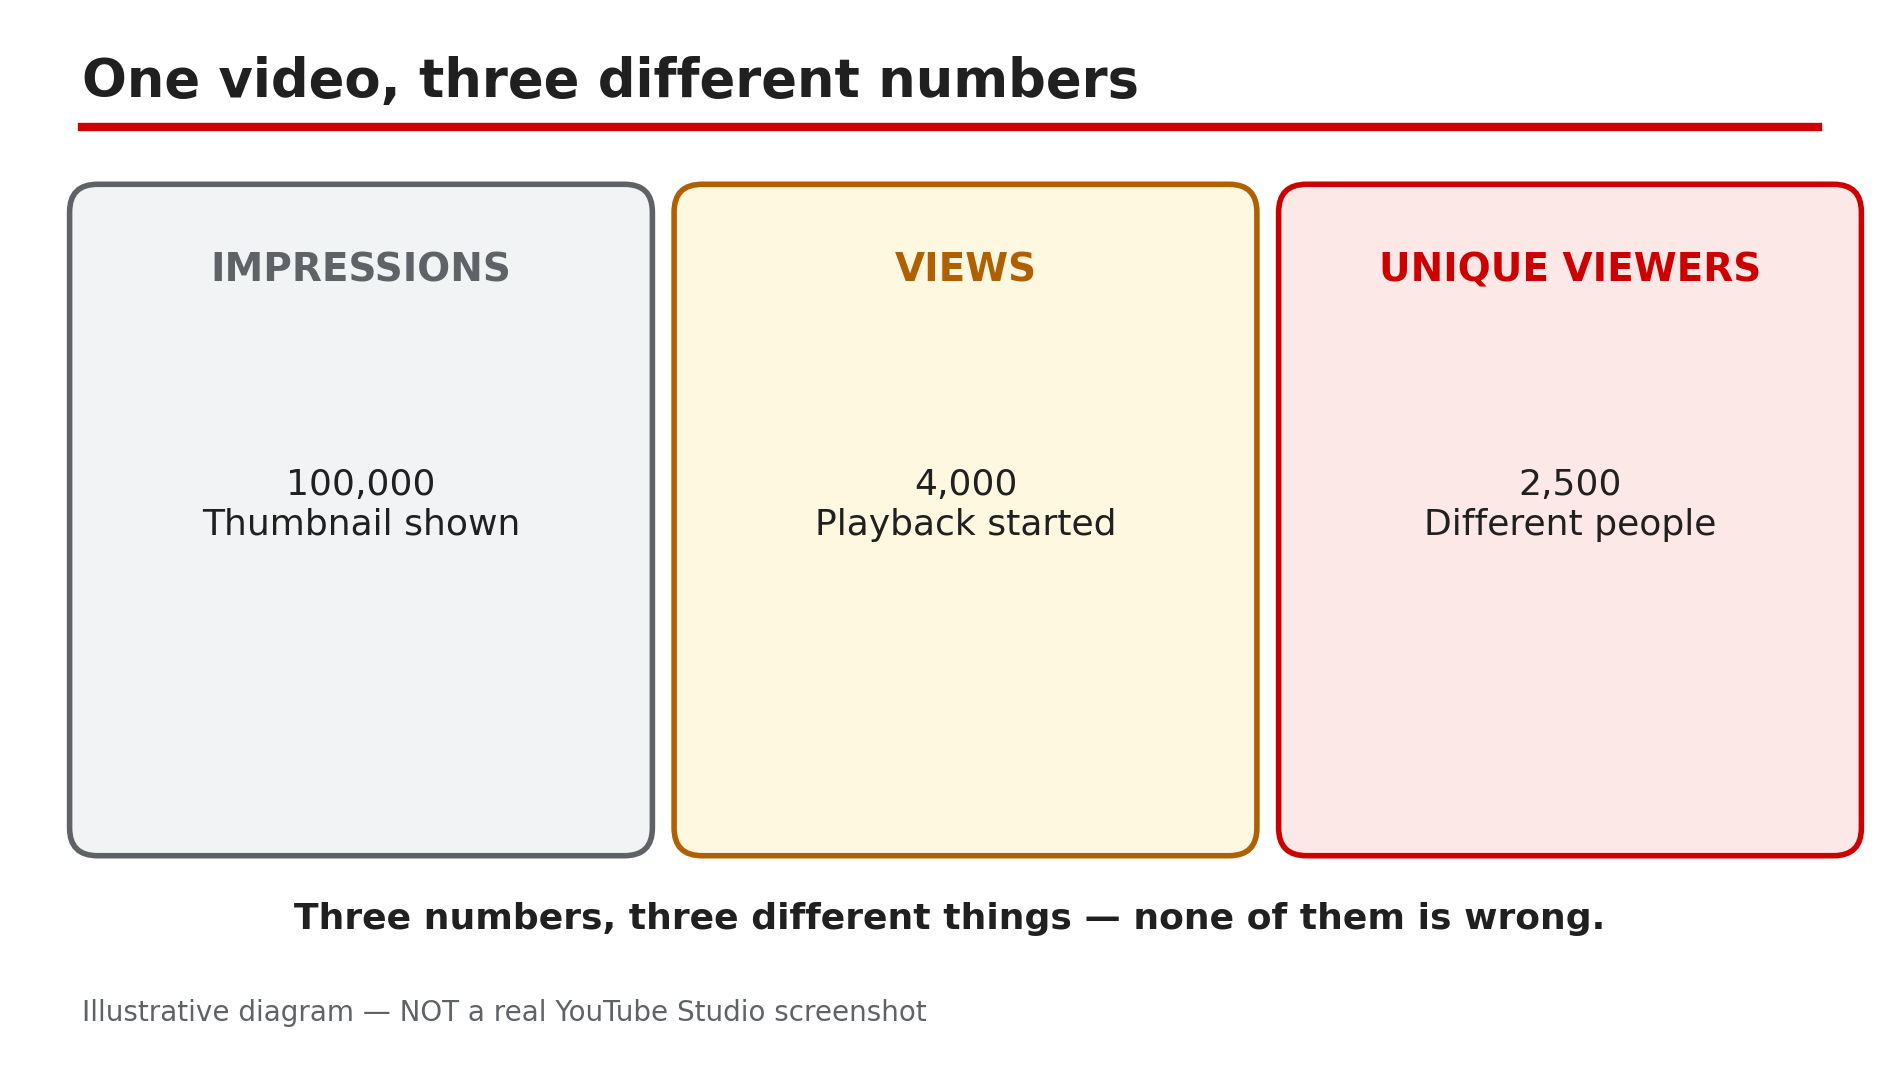
Open YouTube Analytics and you will see three numbers that look like they should agree — and do not. A video can have 100,000 impressions, 4,000 views and only 2,500 unique viewers — and none of those numbers is wrong. They measure three different things: how many times the thumbnail was shown, how many times playback started, and how many different people watched. Confusing them leads to wrong fixes. This guide defines each number the way YouTube does, then shows how to read them together. What You Will LearnWhat an impression is What impressions click-through rate measures How YouTube counts a view since the 24 August 2026 change What unique viewers counts, and why it is always lower than views What unique reach adds, including co-viewing on one TV How to diagnose a video from the three numbersStep 1 — Impressions: how many times your thumbnail was shown What to do: Read impressions as "chances to be clicked", not as viewers. How: YouTube's Help page defines impressions as the number of times your thumbnail was shown to viewers on YouTube. Every appearance on Home, in search, in Suggested videos or in the Shorts feed is one impression — whether the viewer noticed it or not. One person can generate many impressions by scrolling past the same thumbnail again and again. A video that is never surfaced anywhere gets almost no impressions — a video with zero impressions has a distribution problem, not a thumbnail problem. Example: A new video shows 40,000 impressions in its first week. That does not mean 40,000 people saw it — the thumbnail appeared 40,000 times, many of them the same people scrolling past it on Home. Common mistake: Calling 100,000 impressions "100,000 people reached". Reach is a different number — Step 5 — and impressions alone say nothing about how many people noticed it.Illustrative diagram: one video's impressions, views and unique viewers side by side. Step 2 — Impressions click-through rate: of the people who saw it, how many clicked What to do: Use impressions CTR to judge the thumbnail and title together. How: Impressions click-through rate is how often viewers watched a video after seeing its thumbnail. It is a ratio, not a count: 4,000 views from 100,000 impressions is a 4% CTR. YouTube's Help page says half of all channels and videos sit between 2% and 10% impressions CTR, so a 2–3% CTR is not automatically broken — traffic source moves the number more than niche does. Compare against your own recent videos of similar length, which Analytics shows as typical CTR, not against a stranger's screenshot. Example: Two videos each get 50,000 impressions. One gets 1,500 views (3% CTR), the other 5,000 views (10% CTR) — the second thumbnail earned three times as many clicks from the same chances. Common mistake: Judging a video by CTR alone. A 10% CTR on 1,000 impressions is 100 views; a 3% CTR on 1,000,000 impressions is 30,000 views.Illustrative diagram: an impression is a thumbnail shown, a view is playback started. Step 3 — Views: playback started, counted from the first moment since 24 August 2026 What to do: Read views as "playbacks started" — the rule changed on 24 August 2026. How: YouTube's Help page states that since 24 August 2026, views are counted the moment a video starts to play, across all formats. Before that, a Short counted as a view only after a few seconds of watching; now the count starts at playback. That is why Shorts view counts jumped after the change while watch time did not. YouTube also validates playbacks while counting, so the public counter can slow down, freeze or fall while low-quality playbacks are discarded — replaying your own video on two phones is YouTube's own example. Example: A Short published in July 2026 showed 800 views after a day; the same Short republished after the change shows 1,400 views in a day with the same watch time. The audience did not change — the rule did. Common mistake: Comparing a video's views across the 24 August 2026 change as if the rule stayed the same. Views before and after that date were counted differently — a jump or drop across that line is a measurement change, not a performance change.Illustrative diagram: how YouTube's view-counting rule changed on 24 August 2026. Step 4 — Unique viewers: how many different people watched What to do: Read unique viewers as your audience size — one person watching five times is five views but one unique viewer. How: YouTube defines unique viewers as the estimated number of viewers who watched your content within the selected date range. The key word is estimated: YouTube deduplicates by signed-in accounts and device signals, and it cannot perfectly identify every person. The gap tells you about repeat watching — a tutorial with 10,000 views and 9,000 unique viewers was mostly watched once each, while a music video with 10,000 views and 3,000 unique viewers was rewatched heavily. Example: A 10-minute how-to has 5,000 views and 4,800 unique viewers — almost everyone watched once. A 30-second Short has 50,000 views and 12,000 unique viewers — the same people looped it several times each. Common mistake: Treating unique viewers as a smaller, worse version of views. It is the audience size; views are the audience size multiplied by how often they came back.Illustrative diagram: the same view count can mean one repeat viewer or five different people. Step 5 — Unique reach: the people who saw it, including co-viewing on one TV What to do: Use unique reach for how many people the video actually reached, including people watching together. How: Unique reach is the estimated total number of individual people who saw your video or channel, accounting for shared viewing on devices like YouTube TV and the main YouTube app on TV. The Help page gives the example directly: if three people watch your video together on one TV, it counts as one view but the video's unique reach increases by three. The related metric, Views (Co-viewed), does the same — a family of three watching twice counts as six co-viewed views. On a channel whose audience watches on TV, views understate the real audience, and unique reach corrects for it. Example: A family channel's video shows 20,000 views and 32,000 unique reach. The gap is not an error — households watching together on the living-room TV, where one playback reaches three or four people. Common mistake: Comparing unique reach with unique viewers as if they were the same thing. Unique viewers counts people who watched; unique reach counts people who saw the video or channel, including co-viewers who never pressed play.Illustrative diagram: three people watching on one TV count as one view but three in unique reach. Step 6 — Read the three numbers together: the diagnosis is in the combination What to do: Put the three numbers side by side before deciding what to fix — each pattern points at a different problem. How: High impressions with low views means the thumbnail and title are not earning clicks — a packaging problem, and our guide on thumbnail CTR stuck at 2–3% shows how to test your way up. High impressions with low unique viewers means the same small pool keeps seeing the thumbnail — a distribution problem. High views with low unique viewers means heavy rewatching: the video holds its audience but is not reaching new people, so the fix is distribution and topic choice. Low impressions with high CTR means the packaging works but YouTube is not surfacing the video — check the topic and title keywords. Example: One video has 200,000 impressions, 3,000 views and 2,800 unique viewers — CTR is 1.5%, so the thumbnail is the problem. Another has 200,000 impressions, 12,000 views and 3,000 unique viewers — CTR is fine, but the same 3,000 people watched four times each, so the problem is reach. Common mistake: Fixing the thumbnail when the problem is distribution, or re-editing the video when the problem is the thumbnail. The three numbers together tell you which to fix — changing the wrong thing wastes a week.Illustrative diagram: three number patterns and the problem each one points to. Checklist — Read your Analytics numbers correctly☐ Checked impressions in the Reach tab, not just the headline count ☐ Compared impressions CTR with my own recent videos, not a stranger's ☐ Remembered views count from playback start since 24 Aug 2026 ☐ Read unique viewers as audience size, not a smaller view count ☐ Checked unique reach for co-viewing on TV ☐ Compared views with unique viewers to spot rewatching ☐ Diagnosed from the combination, not from one number alone ☐ Did not compare views across the 24 August 2026 counting changeFAQs 1. Why are my views higher than my unique viewers? Views count playbacks; unique viewers count people. One person watching five times is five views and one unique viewer — a big gap usually means heavy rewatching. 2. Why do my impressions keep rising but my views stay flat? Your thumbnail is being shown but not clicked — a thumbnail and title problem. Check the packaging before touching the video itself. 3. Are impressions the same as reach? No. Impressions count how many times the thumbnail was shown, including repeats to the same person. Unique reach counts individual people who saw the video or channel, including people watching together on one TV. 4. Did the 24 August 2026 change make my Shorts views go up? Very likely. Since that date a view counts the moment playback starts, so Shorts views rose while watch time stayed the same. It is a counting change, not an audience change — and it does not change YPP earnings, which still use engaged views. 5. My views froze for a day — is something broken? Usually not. YouTube validates playbacks while counting, so the public counter can slow down, freeze or fall while low-quality playbacks are discarded. A count stuck at zero with no impressions at all is a distribution problem instead. SourcesYouTube Help — "Understand your YouTube content performance" (official page, opened live 12 Nov 2026): https://support.google.com/youtube/answer/12220281?hl=en CreatorPlaybook — "YouTube CTR Suddenly Dropped After the 24 August 2026 View-Counting Change? What Really Happened" (internal link, URL copied from the plan file): </blog/youtube-ctr-suddenly-dropped-after-24> CreatorPlaybook — "How to Read Your YouTube Retention Graph: Dips, Spikes and What to Fix" (internal link, URL copied from the plan file): </blog/how-to-read-your-youtube-retention>
- CreatorPlaybook Team
- 10 Nov, 2026
YouTube Studio Analytics Missing or Delayed? What the Lag Really Means
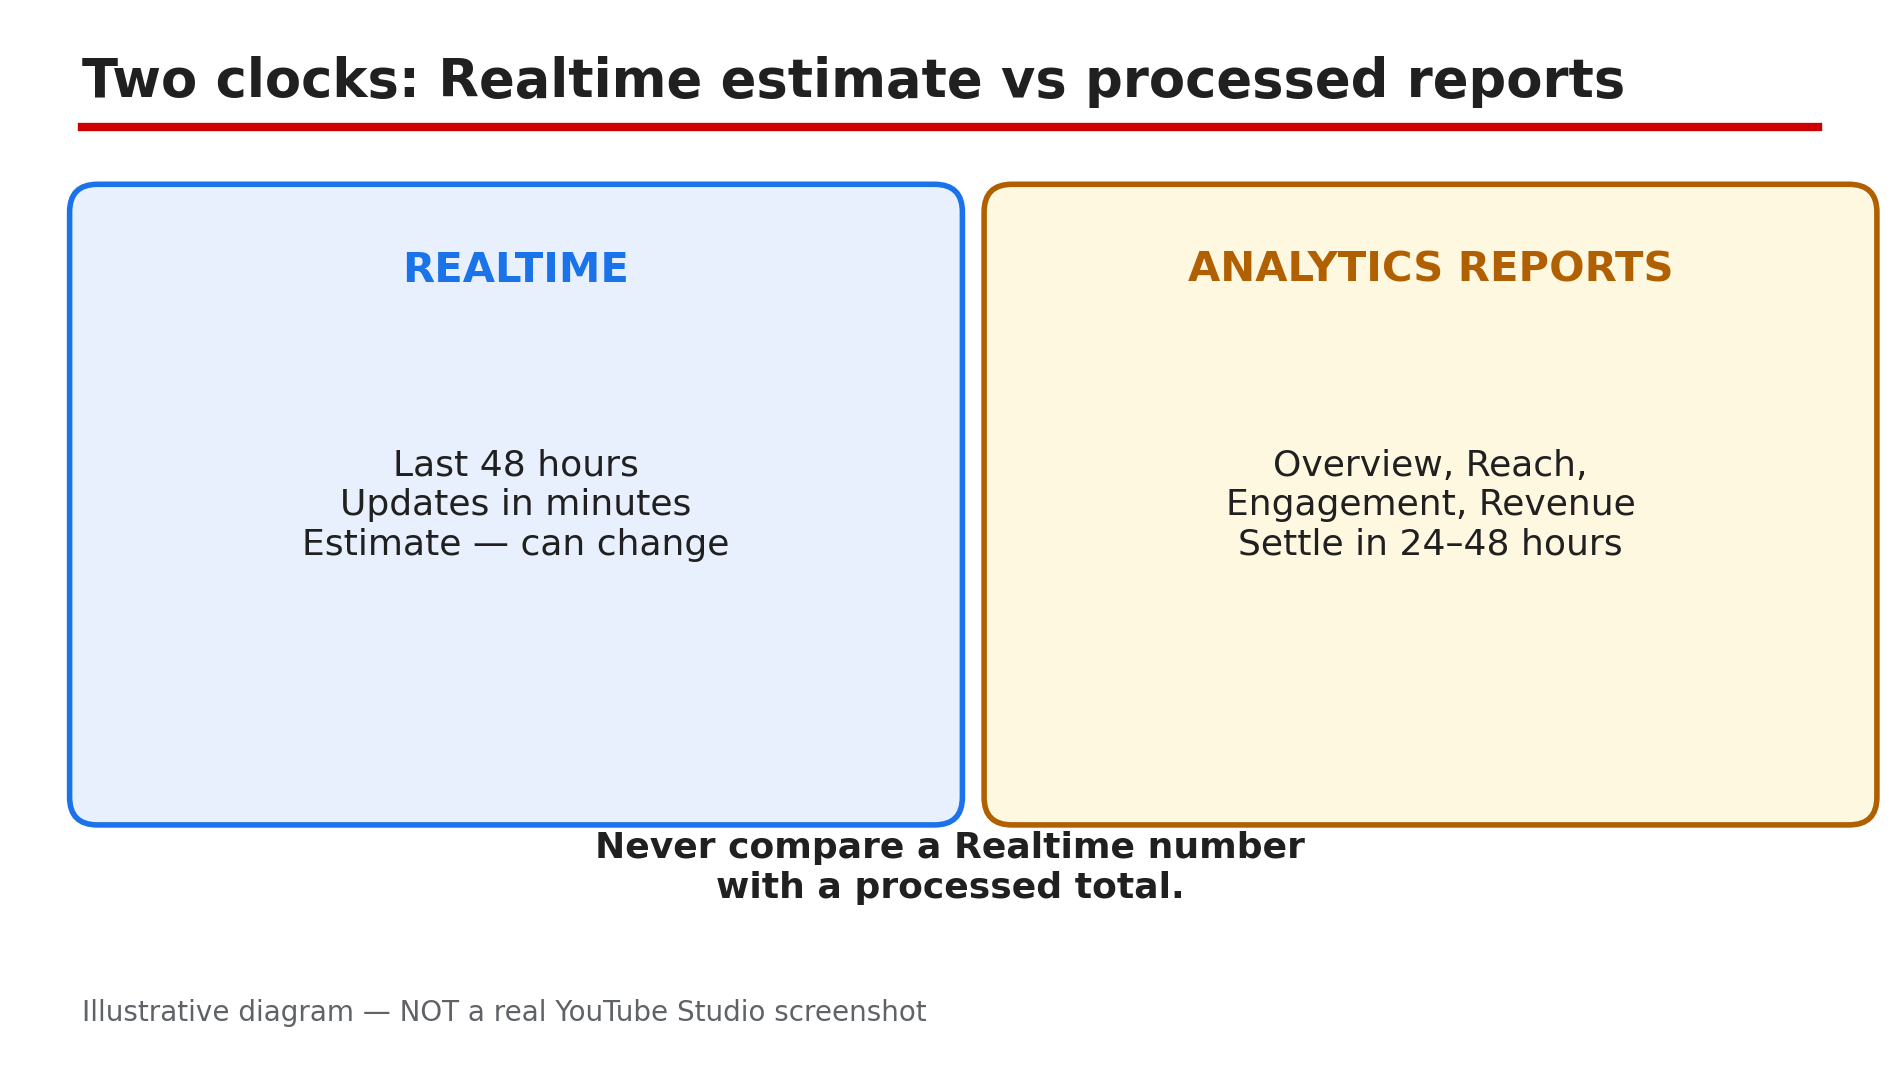
You uploaded a video two days ago, the views are clearly coming in, and Studio Analytics still shows nothing — or a number that has not moved since yesterday. In most cases nothing is broken: YouTube Studio runs on two different clocks, and confusing them is the most common reason creators think their data is missing. The Realtime report is a live estimate of roughly the last 48 hours, while the full Analytics reports take time to process — most metrics settle within 24 to 48 hours, as reported, and YouTube's Help pages confirm a delay of about two days for estimated earnings data. What You Will LearnWhy Realtime and Analytics reports show different numbers — and both can be right How long each report normally takes to fill in Why revenue and membership figures look missing when they are only unfinished The two-minute checks: date range, channel, and report type When to wait, and when a gap means something is actually wrongStep 1 — Learn the two clocks: Realtime estimate vs Analytics reports What to do: Before judging any number, find out which clock you are looking at — Realtime or a processed report. How: Open YouTube Studio and go to Analytics. The Realtime card shows activity from roughly the last 48 hours and updates within minutes — but it is an estimate, not a final count. The Overview, Reach, Engagement, Audience, and Revenue tabs are processed reports that take time to settle: most metrics land within 24 to 48 hours, some stretching to 72 hours. So a video with 500 views in Realtime and zero in Reach is not broken — the processed report has not caught up yet. Compare numbers only within the same report. Example: A creator sees 1,200 views in Realtime on day one and nothing in Reach. On day three Reach shows 1,180 — the 20-view difference is invalid playbacks removed during validation. Common mistake: Refreshing Analytics every hour and concluding the data is stuck — the reports update on YouTube's timetable, not yours.Illustrative diagram: YouTube Studio's two clocks — the fast Realtime estimate and the slower processed reports. Step 2 — Check the date range and the right channel first What to do: Rule out the two most embarrassing causes — the wrong date range and the wrong channel — before assuming data is missing. How: In Analytics, look at the date range at the top of the page. If it ends yesterday, today's views are not in it — extend the range, or switch to Realtime. Then check the channel: tap your profile picture in Studio and confirm you are on the right channel, especially if you manage a Brand Account with several channels. Analytics is per channel, so data for one channel never appears on another. Example: A creator with two channels panics that a new video has zero views, then realises he is looking at his second channel's Analytics. Common mistake: Comparing Realtime views with a channel-level report for a different date range — the numbers will never match.Illustrative mock-up: the two checks that take two minutes and explain most 'missing' Analytics. Step 3 — Understand the revenue clock: estimated vs finalised What to do: If the Revenue tab looks empty or wrong, check whether you are looking at an estimate or a finalised figure — they arrive weeks apart. How: YouTube's Help pages state Analytics has a data delay of about two days for estimated earnings, and estimates do not reflect invalid-activity adjustments in real time — so revenue for the last two days is often blank or low. Finalised earnings are different again: they appear once your payments are added to AdSense for YouTube, typically between the 7th and 12th of the following month. A January figure that looks small on 3 February is not missing — it is not finalised yet. Example: A creator checks her January revenue on 5 February and finds it far below her estimate. By 12 February the finalised figure appears — the gap was invalid traffic removed during finalisation. Common mistake: Treating an estimated revenue figure as money owed — only the finalised number pays out.Illustrative diagram: the revenue timeline from estimated earnings to finalised earnings. Step 4 — Give retention and key moments time to process What to do: If the retention graph is blank or the key moments are missing, check the video's age, length, and view count before calling it a fault. How: Retention data typically takes one to two days to process, as reported, so a graph for a video uploaded this morning is often empty. Key moments — the Intro, Top moments, Spikes, and Dips labels — need a video at least 60 seconds long with at least 100 views, as reported. A 40-second Short or a video with 30 views will never show key moments, and that is by design. Check the Engagement tab after 48 hours. Example: A creator uploads a 90-second video, gets 80 views on day one, and finds no key moments. On day three, past 100 views, the labels appear. Common mistake: Re-editing a video to "fix" a retention graph that only needed another day — the re-upload resets the clock.Illustrative diagram: the three conditions a video must meet before its retention graph and key moments appear. Step 5 — Check membership earnings the right way What to do: If membership earnings look missing from the Revenue tab, check the date range and whether you are comparing an estimate with a finalised figure. How: Membership earnings are reported to go missing most often for two boring reasons. First, the date range is wrong: revenue is counted in the month the member was charged, not the month they joined. Second, creators compare the Revenue tab's estimate with finalised AdSense earnings — two different numbers for different dates. Open the Revenue tab, set the date range to the full month, and look at the memberships row. If members are still being charged and the row is empty after a full month, check that memberships is still switched on in Studio under Earn — a paused feature stops new charges, as reported. Example: A creator sees zero membership earnings for January, then realises her members were charged on 1 February — the figure belonged to February. Common mistake: Assuming a memberships outage because the Revenue tab is empty for the current month — the month is never complete until it ends.Illustrative diagram: membership earnings count in the month the member is charged, not the month they joined. Step 6 — Know when to wait and when to act What to do: Apply a simple rule: under 48 hours, wait; over a week with no movement, act. How: If a number has not moved in under 48 hours, that is normal processing lag, as reported — wait two full days. If nothing has moved for more than a week while your videos are clearly getting views, check YouTube's Known Issues page and try Analytics on a desktop browser, since some reports are not available on mobile. If the gap persists past a week on desktop, with the right channel and date range, use Studio's Send feedback to report it. Example: A channel's views freeze for three days across every video. On day four the numbers jump back — a platform-wide delay, not a channel problem. Common mistake: Deleting and re-uploading a video because its Analytics look empty on day one — you lose the original's history and restart the clock.Illustrative diagram: a decision tree for deciding whether missing Analytics data needs waiting or action. Checklist — Fix YouTube Studio Analytics missing or delayed data☐ Identified whether the number is Realtime or a processed report ☐ Waited 48 hours before judging a new video's reports ☐ Checked the date range includes the days in question ☐ Confirmed the right channel and the right report level ☐ Understood estimated revenue lags about two days ☐ Waited until the 7th to 12th of the next month for finalised earnings ☐ Gave retention one to two days, and key moments 60 seconds plus 100 views ☐ Checked membership earnings against the charging month, not the join month ☐ Tried Analytics on a desktop browser if mobile shows nothing ☐ Checked YouTube's Known Issues page if nothing moves for a weekFAQs 1. How long does YouTube Analytics normally take to update? Realtime updates within minutes as an estimate of the last 48 hours. Most processed metrics settle within 24 to 48 hours, as reported, with some stretching to 72 hours. Estimated earnings carry a delay of about two days, according to YouTube's Help pages. 2. Why does Realtime show views but my Reach tab shows zero? Because they are different clocks. Realtime is a fast estimate; the Reach tab is a processed report that has not caught up yet. Compare numbers only within the same report, and wait 48 hours before worrying. 3. Why did my view count go down in Analytics? Because YouTube validates playbacks while counting and removes invalid ones, as reported. A count that drops slightly is the system working correctly — see our guide on Realtime views stuck. 4. My revenue for this month is blank. Is monetisation off? Probably not. Estimated earnings lag about two days, and finalised earnings appear only between the 7th and 12th of the following month, according to YouTube's Help page. 5. My retention graph is empty two days after uploading. What should I do? First check the video is at least 60 seconds long with 100 or more views, as reported — key moments need both. If it is longer and well past 100 views after 48 hours, try a desktop browser. SourcesYouTube Help — "Get started with YouTube Analytics" (official page, opened live 10 Nov 2026): https://support.google.com/youtubecreatorstudio/answer/9002587?hl=en&co=GENIE.Platform%3DiOS CreatorPlaybook — "YouTube Realtime Views Stuck? Why the Count Freezes and When to Wait" (internal link, live-verified published post): </blog/youtube-realtime-views-stuck-why> CreatorPlaybook — "How to Read Your YouTube Retention Graph and Fix Drop-Offs" (internal link, live-verified published post): </blog/how-to-read-your-youtube-retention>